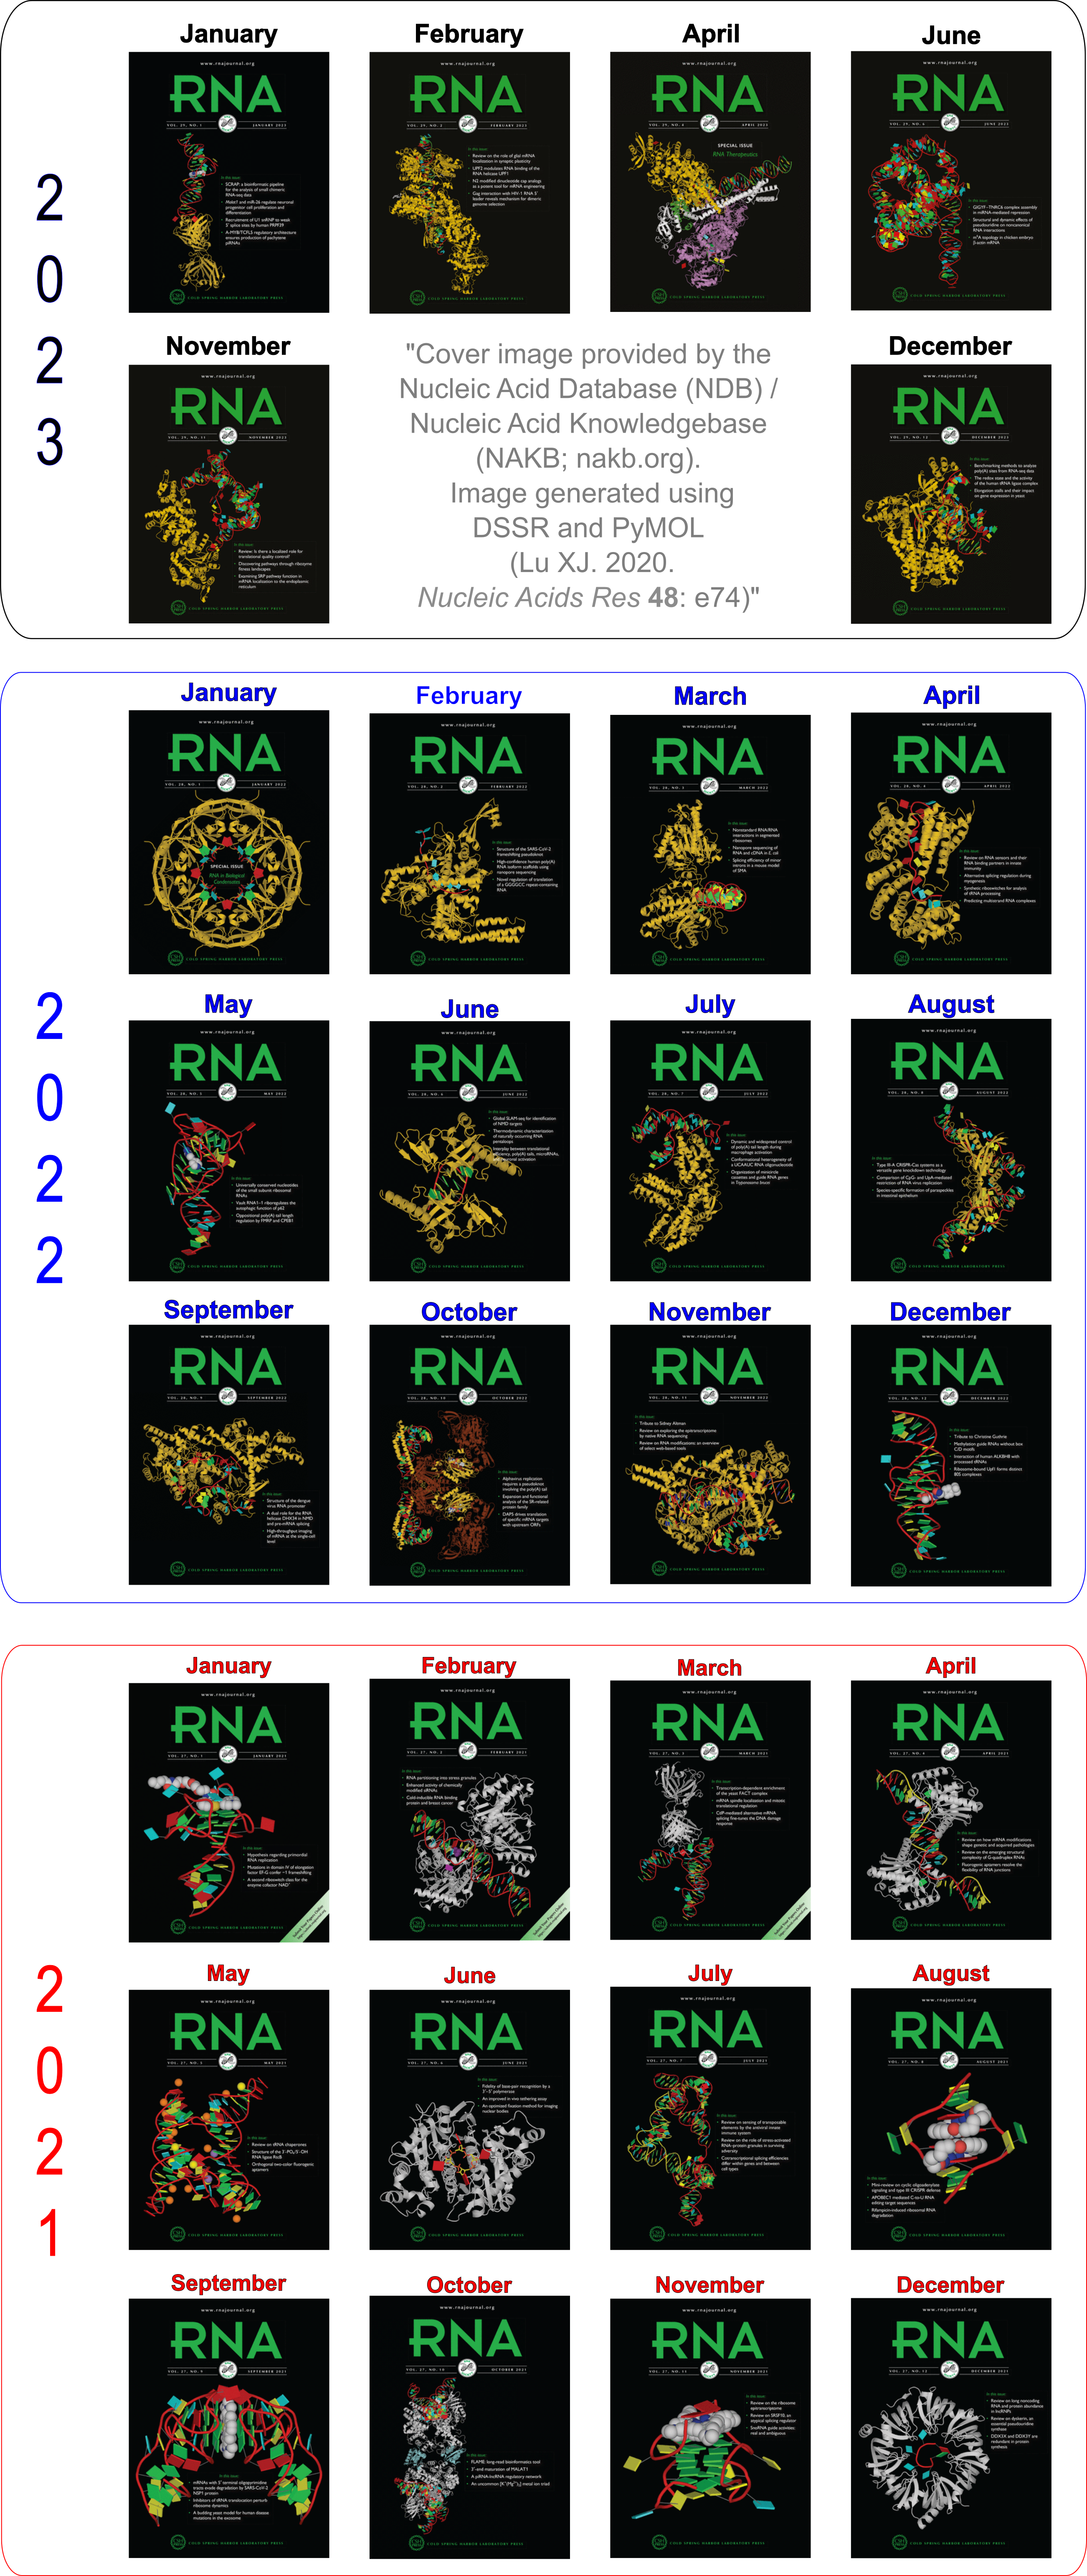
Cover image provided by X3DNA-DSSR, an NIGMS National Resource for structural bioinformatics of nucleic acids (R24GM153869; skmatics.x3dna.org). Image generated using DSSR and PyMOL (Lu XJ. 2020. [Nucleic Acids Res 48: e74(https://doi.org/10.1093/nar/gkaa426)).
See the 2020 paper titled "DSSR-enabled innovative schematics of 3D nucleic acid structures with PyMOL" in Nucleic Acids Research and the corresponding Supplemental PDF for details. Many thanks to Drs. Wilma Olson and Cathy Lawson for their help in the preparation of the illustrations.
Details on how to reproduce the cover images are available on the 3DNA Forum.

Structure of a group II intron ribonucleoprotein in the pre-ligation state (PDB id: 8T2R; Xu L, Liu T, Chung K, Pyle AM. 2023. Structural insights into intron catalysis and dynamics during splicing. Nature 624: 682–688). The pre-ligation complex of the Agathobacter rectalis group II intron reverse transcriptase/maturase with intron and 5′-exon RNAs makes it possible to construct a picture of the splicing active site. The intron is depicted by a green ribbon, with bases and Watson-Crick base pairs represented as color-coded blocks: A/A-U in red, C/C-G in yellow, G/G-C in green, U/U-A in cyan; the 5′-exon is shown by white spheres and the protein by a gold ribbon. Cover image provided by X3DNA-DSSR, an NIGMS National Resource for structural bioinformatics of nucleic acids (R24GM153869; skmatics.x3dna.org). Image generated using DSSR and PyMOL (Lu XJ. 2020. Nucleic Acids Res 48: e74).

Complex of terminal uridylyltransferase 7 (TUT7) with pre-miRNA and Lin28A (PDB id: 8OPT; Yi G, Ye M, Carrique L, El-Sagheer A, Brown T, Norbury CJ, Zhang P, Gilbert RJ. 2024. Structural basis for activity switching in polymerases determining the fate of let-7 pre-miRNAs. Nat Struct Mol Biol 31: 1426–1438). The RNA-binding pluripotency factor LIN28A invades and melts the RNA and affects the mechanism of action of the TUT7 enzyme. The RNA backbone is depicted by a red ribbon, with bases and Watson-Crick base pairs represented as color-coded blocks: A/A-U in red, C/C-G in yellow, G/G-C in green, U/U-A in cyan; TUT7 is represented by a gold ribbon and LIN28A by a white ribbon. Cover image provided by X3DNA-DSSR, an NIGMS National Resource for structural bioinformatics of nucleic acids (R24GM153869; skmatics.x3dna.org). Image generated using DSSR and PyMOL (Lu XJ. 2020. Nucleic Acids Res 48: e74).

Cryo-EM structure of the pre-B complex (PDB id: 8QP8; Zhang Z, Kumar V, Dybkov O, Will CL, Zhong J, Ludwig SE, Urlaub H, Kastner B, Stark H, Lührmann R. 2024. Structural insights into the cross-exon to cross-intron spliceosome switch. Nature 630: 1012–1019). The pre-B complex is thought to be critical in the regulation of splicing reactions. Its structure suggests how the cross-exon and cross-intron spliceosome assembly pathways converge. The U4, U5, and U6 snRNA backbones are depicted respectively by blue, green, and red ribbons, with bases and Watson-Crick base pairs shown as color-coded blocks: A/A-U in red, C/C-G in yellow, G/G-C in green, U/U-A in cyan; the proteins are represented by gold ribbons. Cover image provided by X3DNA-DSSR, an NIGMS National Resource for structural bioinformatics of nucleic acids (R24GM153869; skmatics.x3dna.org). Image generated using DSSR and PyMOL (Lu XJ. 2020. Nucleic Acids Res 48: e74).

Structure of the Hendra henipavirus (HeV) nucleoprotein (N) protein-RNA double-ring assembly (PDB id: 8C4H; Passchier TC, White JB, Maskell DP, Byrne MJ, Ranson NA, Edwards TA, Barr JN. 2024. The cryoEM structure of the Hendra henipavirus nucleoprotein reveals insights into paramyxoviral nucleocapsid architectures. Sci Rep 14: 14099). The HeV N protein adopts a bi-lobed fold, where the N- and C-terminal globular domains are bisected by an RNA binding cleft. Neighboring N proteins assemble laterally and completely encapsidate the viral genomic and antigenomic RNAs. The two RNAs are depicted by green and red ribbons. The U bases of the poly(U) model are shown as cyan blocks. Proteins are represented as semitransparent gold ribbons. Cover image provided by X3DNA-DSSR, an NIGMS National Resource for structural bioinformatics of nucleic acids (R24GM153869; skmatics.x3dna.org). Image generated using DSSR and PyMOL (Lu XJ. 2020. Nucleic Acids Res 48: e74).

Structure of the helicase and C-terminal domains of Dicer-related helicase-1 (DRH-1) bound to dsRNA (PDB id: 8T5S; Consalvo CD, Aderounmu AM, Donelick HM, Aruscavage PJ, Eckert DM, Shen PS, Bass BL. 2024. Caenorhabditis elegans Dicer acts with the RIG-I-like helicase DRH-1 and RDE-4 to cleave dsRNA. eLife 13: RP93979. Cryo-EM structures of Dicer-1 in complex with DRH-1, RNAi deficient-4 (RDE-4), and dsRNA provide mechanistic insights into how these three proteins cooperate in antiviral defense. The dsRNA backbone is depicted by green and red ribbons. The U-A pairs of the poly(A)·poly(U) model are shown as long rectangular cyan blocks, with minor-groove edges colored white. The ADP ligand is represented by a red block and the protein by a gold ribbon. Cover image provided by X3DNA-DSSR, an NIGMS National Resource for structural bioinformatics of nucleic acids (R24GM153869; skmatics.x3dna.org). Image generated using DSSR and PyMOL (Lu XJ. 2020. Nucleic Acids Res 48: e74).
Moreover, the following 30 [12(2021) + 12(2022) + 6(2023)] cover images of the RNA Journal were generated by the NAKB (nakb.org).
Cover image provided by the Nucleic Acid Database (NDB)/Nucleic Acid Knowledgebase (NAKB; nakb.org). Image generated using DSSR and PyMOL (Lu XJ. 2020. Nucleic Acids Res 48: e74).
Given the primary sequence of an RNA molecule, there are numerous methods for predicting its secondary (2D) structures. To judge their accuracy, three-dimensional (3D) RNA structures solved experimentally by X-ray or NMR as deposited in the PDB are often used as benchmarks. DSSR is a handy tool to derive an RNA 2D structure from its 3D coordinates in PDB or mmCIF format. The 2D structure is specified in the dot-bracket notation (dbn), which can be fed directly into drawing programs such as VARNA for interactive display and easy generation of publication quality 2D diagrams.
Over the past few months, I’ve been asked a few times on the details of how the diagrams in the DSSR post were created. The answer is really simple, and has already been mentioned above and in the post. Here are two concrete examples to show how the process works.
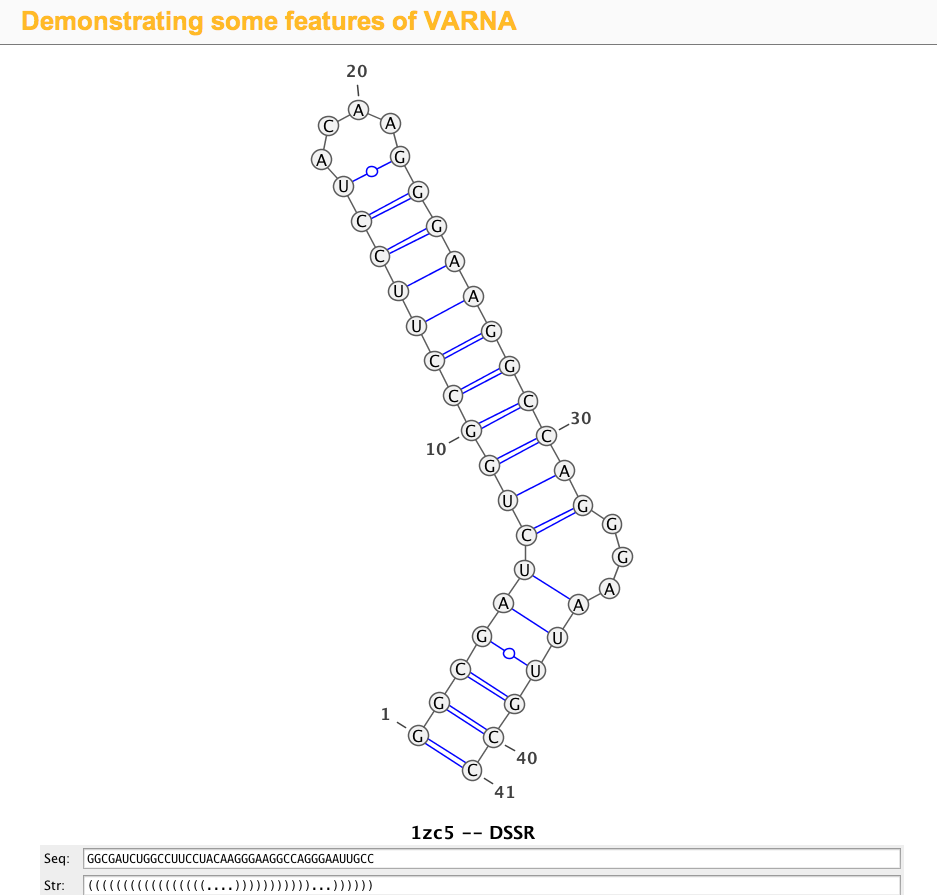
1zc5 (structure of the RNA signal essential for translational frame shifting in HIV-1)
This is the structure used in the VARNA paper. Let the PDB file be named 1zc5.pdb, the DSSR program can be run like this:
x3dna-dssr -i=1zc5.pdb
The output is sent to stdout by default, with the following three lines towards the end:
>1zc5-A #1 RNA with 41 nts
GGCGAUCUGGCCUUCCUACAAGGGAAGGCCAGGGAAUUGCC
(((((((((((((((((....)))))))))))...))))))
Simply copy and paste the last two lines (sequence and the 2D structure in dbn notation) into the Seq: and Str: fields of the VARNA demo page, the diagram will be updated automatically, as shown in the screenshot:
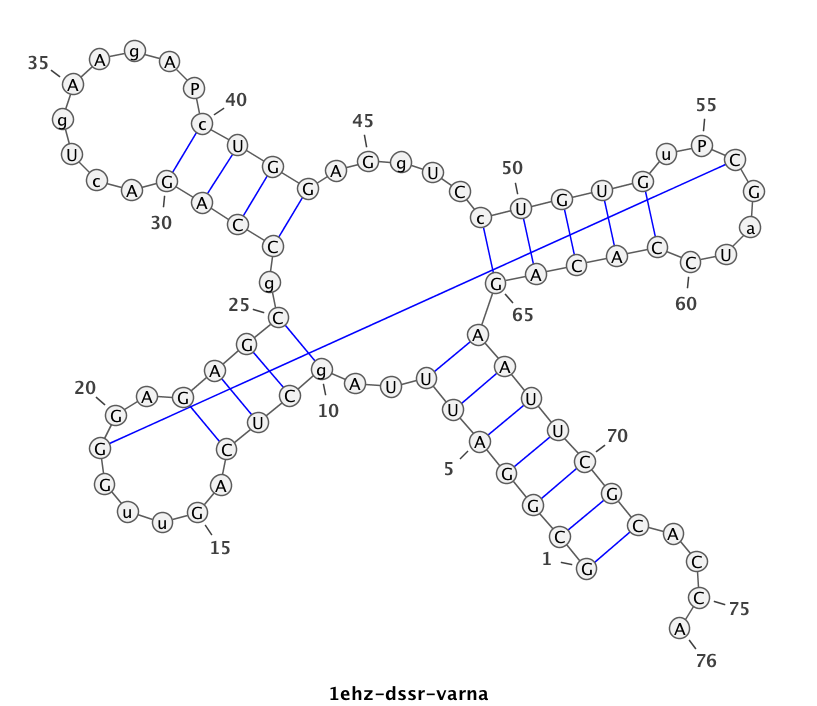
1ehz (crystal structure of yeast phenylalanine tRNA at 1.93 Å resolution)
This example (1ehz.pdb) is used to illustrate tRNA’s classic cloverleaf 2D structure. The related command and result are:
x3dna-dssr -i=1ehz.pdb -o=1ehz.out

# the output is sent to file '1ehz.out'
# towards its end are the following 3 lines

>1ehz-A #1 RNA with 76 nts
GCGGAUUUAgCUCAGuuGGGAGAGCgCCAGAcUgAAgAPcUGGAGgUCcUGUGuPCGaUCCACAGAAUUCGCACCA
(((((((..((((.....[..)))).((((.........)))).....(((((..]....))))))))))))....
I’ve used a local copy of the JAVA web start version of VARNA (VARNA-WebStart.jnlp) to generate the following 2D diagram. Here, in addition to the customized title, I have set the number period to 5 nts, adopted the simple base-pair style, and manually adjusted the T arm (upper right corner) to make the long line connecting G19 and C56 a bit more unobtrusive. Right-click to see the context menu.
Note that the G19—C56 pair creates a pseudo-knot (specified by the matching [] pair in the dbn notation above) in tRNA. I was not aware of this salient feature from previous knowledge of relevant literature. It was indeed a surprise when I first saw it in the 2D diagram.
As illustrated above, DSSR serves well as a bridge from RNA 3D to 2D structures. Give DSSR a try, you will find the program actually has much more to offer!

As of the beta-r14-on-20130626 release, DSSR has the functionality to identify kink-turns and reverse k-turns given an RNA structure in PDB format.
The k-turn motif was first described by Klein et al. (2001) in the paper The kink-turn: a new RNA secondary structure motif, based on analyses of the H. marismortui large ribosomal unit. It turns out to be a widespread structural motif, now with a dedicated k-turn database hosted by the Lilley laboratory.
Geometrically, k-turn is composed of an asymmetric internal loop, with a sharp kink between the two framing helices and characteristic loop features (including at least one sheared G-A pair and A-minor interactions). Overall, k-turn is a complicated motif, and I am not aware of any published method or available software for its auto-detection.
Previous releases of DSSR has built up all the necessary components to detect key features of a k-turn. Over the past few weeks, I have been focusing on connecting the dots to implement an algorithm for its auto-identification. As of beta-r14-on-20130626, DSSR can locate ‘simple’ k-turns or reverse k-turns from an RNA structure in PDB format. I understand the subtleties and variations of k-turns, and will refine the algorithm in future releases of DSSR.
Without putting k-turns under its umbrella, DSSR appears incomplete in its functionality. Hopefully, detection of k-turns will help DSSR gain more attention from the RNA structure community.

Over the past six months or so, I’ve been focusing mostly on developing DSSR, a new addition to the 3DNA suite of programs. So what is DSSR, specifically? Why did I bother to create it? How would it be relevant to the nucleic acid structure community?
Literally, DSSR stands for Defining the (Secondary) Structures of RNA. Starting from an RNA structure in PDB format, DSSR employs a set of simple criteria to identify all existent base pairs (bp): both canonical Watson–Crick (WC) pairs and non-canonical pairs with at least one H-bond, made up of normal or modified bases, regardless of tautomeric or protonation state. The classification is based on the six standard rigid-body bp parameters (shear, stretch, stagger, propeller, buckle, and opening), which together rigorously quantify the spatial disposition of any two interacting bases. Moreover, the program characterizes each bp by commonly used names (WC, reverse WC, Hoogsteen, reverse Hoogsteen, wobble, sheared, imino, Calcutta, and dinucleotide platform), the Saenger classification scheme of 28 types, and the Leontis-Westhof nomenclature of 12 basic geometric classes. DSSR also checks for non-pairing interactions (H-bonds or base stacking).
DSSR detects triplets and even higher-order base associations by searching horizontally in the plane of the associated bp for further H-bonding interactions. The program determines helical regions by exploring each bp’s neighborhood vertically for base-stacking interactions, regardless of backbone connection (e.g., coaxial stacking of helices or pseudo helices). Moreover, each helix/stem is characterized by a least-squares fitted helical axis to allow for easy quantification of relative helical geometry. DSSR calculates commonly used backbone (including the virtual η/θ) torsion angles, classifies the main chain backbone into BI/BII conformation and the sugar into C2’/C3’-endo like pucker, identifies A-minor interactions (types I and II), ribose zippers, G quartets, hairpin loops, kissing loops, bulges, internal loops and multi-branch loops (junctions). It also detects the existence of pseudo-knots, and outputs RNA secondary structure in the dot-bracket notation.
Experienced 3DNA users may notice that some of the above outlined functionality (e.g., calculation of torsion angles, identification of all pairs, higher order base associations, and helices) have existed for over a decade. Over the years, I have written several posts (see What can 3DNA do for RNA structures?, and links therein) to advocate 3DNA’s applications in RNA structural analysis. Nevertheless, 3DNA has never been widely used in the RNA structure community, for various possible reasons: (1) the misconception that 3DNA is only for DNA (but not RNA); (2) the basic functionality is split into two programs (find_pair and analyze), and needs to be run several times with different options (default find_pair, and with -s, or -p). Thus even though 3DNA is applicable to RNA structures, it is unnecessarily complicated and confusing (especially to new 3DNA users); (3) 3DNA is command-line driven, consisting of many C programs and scripts, with different styles in specifying options. It has the ‘reputation’ of being powerful, but cryptic and hard to use.
I’ve created DSSR from scratch to take consideration of these factors, by employing my extensive experience in supporting 3DNA, an increased knowledge in RNA structures and refined C programming skills. Implemented in ANSI C as a stand-alone command-line program, DSSR is self-contained. Its executables (on MacOS X, Linux and Windows) have zero runtime dependencies. No setup is necessary; simply put the program into a folder of your choice (preferably one on your command PATH), and it should work. DSSR has sensible default settings and an intuitive output, making it directly accessible to a much broader audience than 3DNA per se. Since its initial release on March 3, 2013, I’ve yet to hear any installation or usage problem. So far, all reported bugs have been verified and fixed promptly. The latest beta release has been checked against all nucleic-acid-containing entries in the PDB, without any known issues.
Overall, DSSR consolidates, refines, and significantly extends 3DNA’s functionality for RNA structural analysis. There are more in DSSR than its simple interface suggests. Piecewise, DSSR may appear nothing new, yet combined together, it has unique features not available anywhere else. Its value will be gradually appreciated as DSSR becomes more widely used by the community. Want to know if your structure contains any Hoogsteen pair, sheared G•A pair, or a dinucleotide platform? DSSR can check it for you, easily.
DSSR-beta already possesses all the basic functionality and has been well tested to serve as a handy tool for RNA structural analysis. I stand firmly behind DSSR, and strive to continuously improve the program. Give it a try, and report back on the 3DNA Forum any issues you have. As always, I respond quickly and concretely to all questions posted there. I hope you enjoying using DSSR as much as I enjoy creating and supporting it!

In the field of nucleic acid structures, especially in the ‘RNA world’, we often hear named base pairs (bp). Among those, the Watson-Crick (WC) A–U and G–C bps (see figure below) are by far the most common.
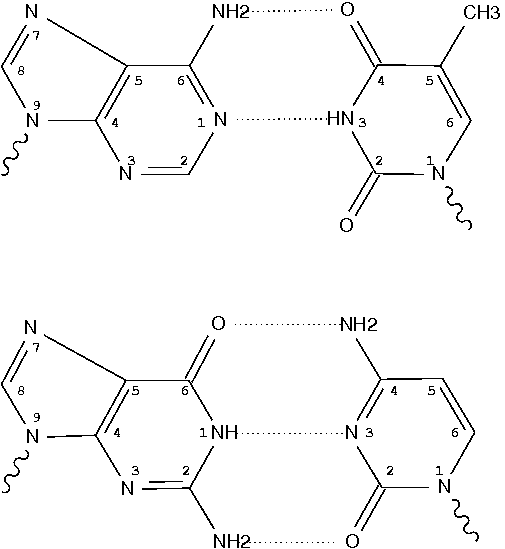
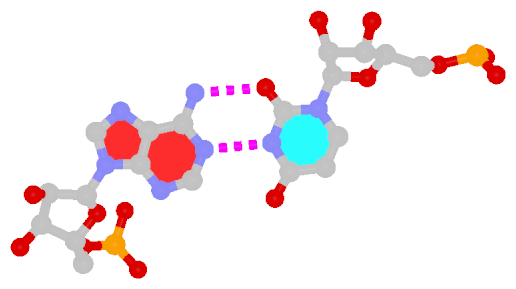
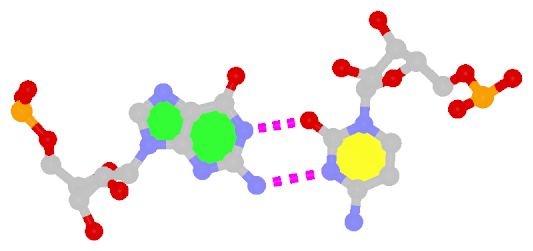
Closely related to the WC bps are the so-called reversed WC (rWC) bps, where the relative glycosidic bond are reversed; instead of being on the same side of the bases as in WC bps shown above, they are now on opposite sides in rWC bps as shown below. According to the Leontis-Westhof (LW) bp classification scheme, the rWC bps belong to trans WC/WC. Following Saenger’s numbering, the rWC A+U bp corresponds to XXI, and the rWC G+C bp XXII.
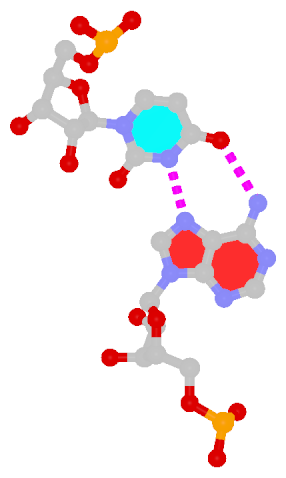
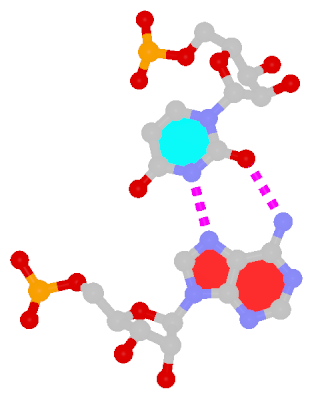
In the figures below, the name of each type of bp and its LW & Saenger designations (separated by ‘;’) are noted under the corresponding image. All images are generated with 3DNA; for easy comparison, each bp is oriented in the reference frame of the leading base.
 |
 |
| Reversed WC A+U pair |
Reversed WC G+C pair |
| trans WC/WC; XXI |
trans WC/WC; XXII |
The next most famous one is the Hoogsteen A+U bp, which also has a reverse variant, i.e., the rHoogsteen A–U bp (see figure below). Now the major groove edge of A, termed the Hoogsteen edge by LW, is used for pairing with U.
 |
 |
| Hoogsteen A+U pair |
Reversed Hoogsteen A–U pair |
| cis Hoogsteen/WC; XXIII |
trans Hoogsteen/WC; XXIV |
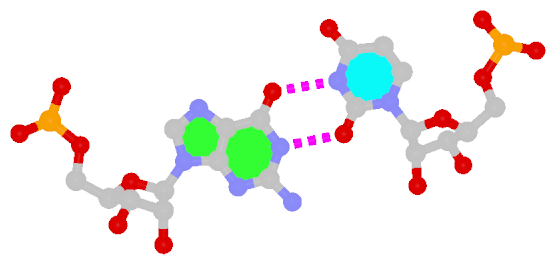
First proposed by Crick in 1966 to account for the degeneracy in codon–anticodon pairing, the Wobble bp is an essential component (in addition to the WC bps) in forming double helical RNA secondary structures.
 |
| Wobble G–U pair |
| cis WC/WC; XXVIII |
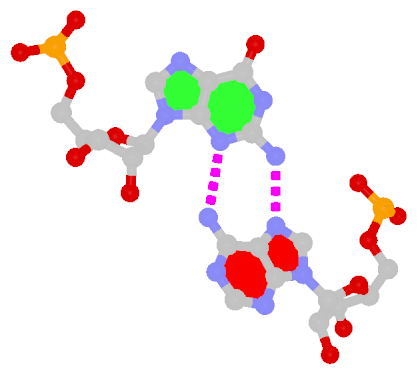
The sheared G–A base pair
Sheared G–A is a commonly found non-WC bp in both DNA and RNA structures. Noticeably, tandem sheared G–A bps introduce distinct stacking geometry. Here G uses its minor groove edge, termed the sugar edge by LW, to pair with the Hoogsteen edge of A.
 |
| Sheared G–A pair |
| trans Suger/Hoogsteen; XI |
Dinucleotide platforms
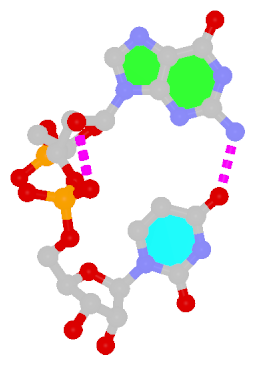
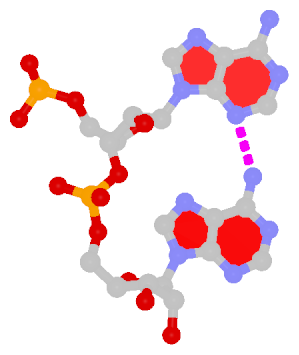
Dinucleotide platforms are formed via side-by-side pairing of adjacent bases; the most common of which are GpU and ApA. Here the sugar (minor-groove) edge of the 5′ base interacts with the Hoogsteen (major-groove) edge of the 3′ base. Since there is only one base-base H-bond in dinucleotide platforms, no Saenger classification is available. In 3DNA output, the GpU dinucleotide platform is designated as G+U, and ApA as A+A.
 |
 |
| GpU dinucleotide platform |
ApA dinucleotide platform |
| cis Sugar/Hoogsteen; n/a |
cis Sugar/Hoogsteen; n/a |
Other named base pairs
There exist other named bps in RNA literature, e.g., G⋅A imino, A⋅C reverse Hoogsteen, G⋅U reverse Wobble etc. In the my experience, they are (much) less commonly used than the ones illustrated above.

From v1.5 or even earlier on, 3DNA provides an automatic classification of a dinucleotide step into A-, B- or TA-DNA conformation. Figure 5 of the 2003 3DNA Nucleic Acids Research paper (NAR03) shows three sets of scatter plots — helical inclination and x‐displacement, dimer step Roll and Slide, and the projected phosphorus z coordinates Zp and Zp(h) — to differentiate the A-, B- and TA-DNA dinucleotide steps.

Among the criteria tested, the most discriminative ones are the projected phosphorus z coordinates, Zp in the middle step frame (see figure below), and Zp(h) defined similarly but in the middle helical frame.
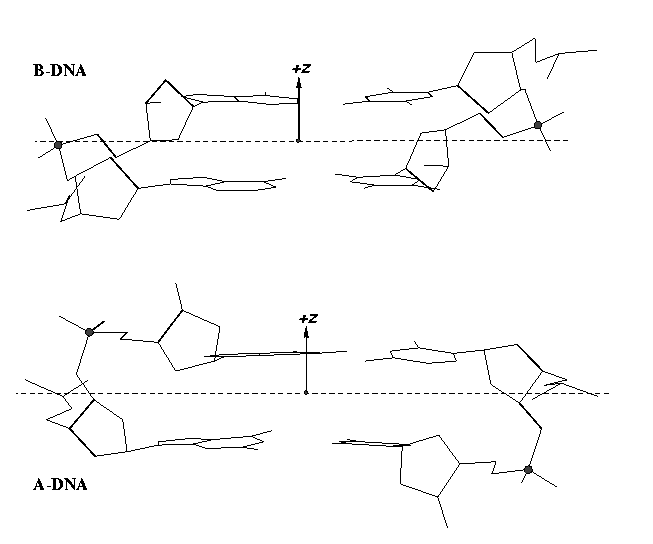
Over the years, I have received many questions regarding the datasets used in generating Figure 5 of NAR03. Back in August 2006, a user asked for IDs of the TA-DNA structures — see DNA standards/statistics using 3DNA. In April 2007, another user requested the same TA-DNA dataset. Early this year, a user asked for 3DNA’s A-DNA definition. More recently, yet another user would like to ask about the DNA set used for the analysis that is presented in Fig 5. in the NAR 2003 paper.
I am glad to see that after nearly a decade of the NAR03 publication, the user community is still interested in knowing details in the work. So I decided to dig into my archive for the original data files and scripts used to generate Figure 5 of NAR03. It was not an easy journey; just releasing the data files and scripts is not enough, I’d like to verify that they work together as intended in today’s computing environment. Luckily, I am finally able to get to the bottom of the issues. The details are in the post Datasets and scripts for reproducing Figure 5 of the 3DNA NAR03 paper. The tarball file named 3DNA-NAR03-Fig5.tar.gz is available by clicking the link.

As noted in post Rectangular block expressed in MDL molfile format, I added the -mol option (in v2.1) to convert 3DNA’s native alchemy to the better-supported MDL molfile format, to make the characteristic schematic representations more widely accessible. Along the line, I have recently further augmented alc2img with the -pdb option to transform alchemy to the PDB format.
While the macromolecular PDB format is certainly not convenient for specifying linkage details of small molecules, it’s nevertheless the best-documented and by far the most widely supported than molfile or alchemy in currently available molecular viewers. For example, the PDB format is consistently supported in Jmol, PyMOL, RasMol, DeepView, and UCSF Chimera. Moreover, the PDB format does have the CONECT section to provide information on atomic connectivity:
The CONECT records specify connectivity between atoms for which coordinates are supplied. The connectivity is described using the atom serial number as shown in the entry. CONECT records are mandatory for HET groups (excluding water) and for other bonds not specified in the standard residue connectivity table.
The alc2img -pdb option takes advantage of the CONECT records and specifies all ‘bond’ linkages explicitly. The usage is very simple — take the standard base-pair rectangular block file (‘Block_BP.alc’) as an example, the conversion can be performed as below:
alc2img -pdb Block_BP.alc Block_BP.pdb
Content of ‘Block_BP.alc’
   12 ATOMS,    12 BONDS
    1 N      -2.2500   5.0000   0.2500
    2 N      -2.2500  -5.0000   0.2500
    3 N      -2.2500  -5.0000  -0.2500
    4 N      -2.2500   5.0000  -0.2500
    5 C       2.2500   5.0000   0.2500
    6 C       2.2500  -5.0000   0.2500
    7 C       2.2500  -5.0000  -0.2500
    8 C       2.2500   5.0000  -0.2500
    9 C      -2.2500   5.0000   0.2500
   10 C      -2.2500  -5.0000   0.2500
   11 C      -2.2500  -5.0000  -0.2500
   12 C      -2.2500   5.0000  -0.2500
    1     1     2
    2     2     3
    3     3     4
    4     4     1
    5     5     6
    6     6     7
    7     7     8
    8     5     8
    9     9     5
   10    10     6
   11    11     7
   12    12     8
Content of ‘Block_BP.pdb’
REMARK    3DNA v2.1 (c) 2012 Dr. Xiang-Jun Lu (http://x3dna.org)
HETATM    1  N   ALC A   1      -2.250   5.000   0.250  1.00  1.00           N
HETATM    2  N   ALC A   1      -2.250  -5.000   0.250  1.00  1.00           N
HETATM    3  N   ALC A   1      -2.250  -5.000  -0.250  1.00  1.00           N
HETATM    4  N   ALC A   1      -2.250   5.000  -0.250  1.00  1.00           N
HETATM    5  C   ALC A   1       2.250   5.000   0.250  1.00  1.00           C
HETATM    6  C   ALC A   1       2.250  -5.000   0.250  1.00  1.00           C
HETATM    7  C   ALC A   1       2.250  -5.000  -0.250  1.00  1.00           C
HETATM    8  C   ALC A   1       2.250   5.000  -0.250  1.00  1.00           C
HETATM    9  C   ALC A   1      -2.250   5.000   0.250  1.00  1.00           C
HETATM   10  C   ALC A   1      -2.250  -5.000   0.250  1.00  1.00           C
HETATM   11  C   ALC A   1      -2.250  -5.000  -0.250  1.00  1.00           C
HETATM   12  C   ALC A   1      -2.250   5.000  -0.250  1.00  1.00           C
CONECT    1    2    4
CONECT    2    1    3
CONECT    3    2    4
CONECT    4    1    3
CONECT    5    6    8    9
CONECT    6    5    7   10
CONECT    7    6    8   11
CONECT    8    5    7   12
CONECT    9    5
CONECT   10    6
CONECT   11    7
CONECT   12    8
END

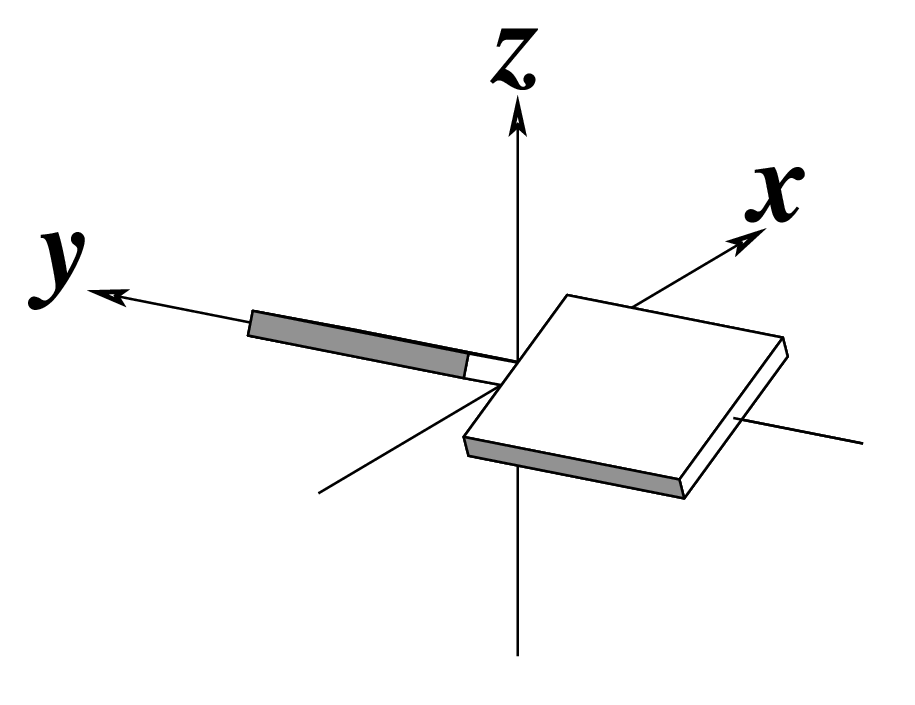
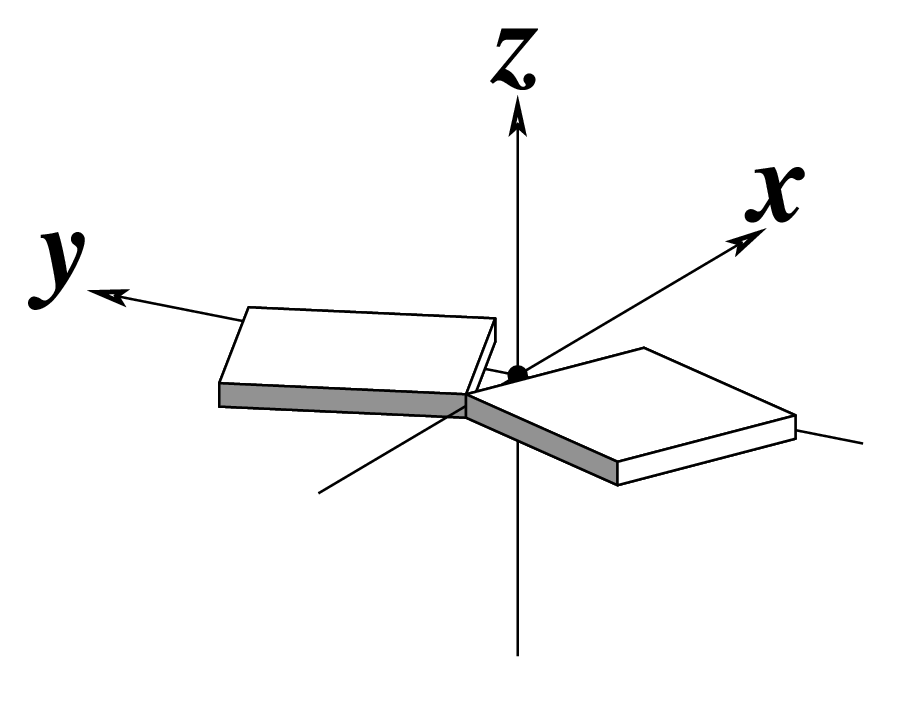
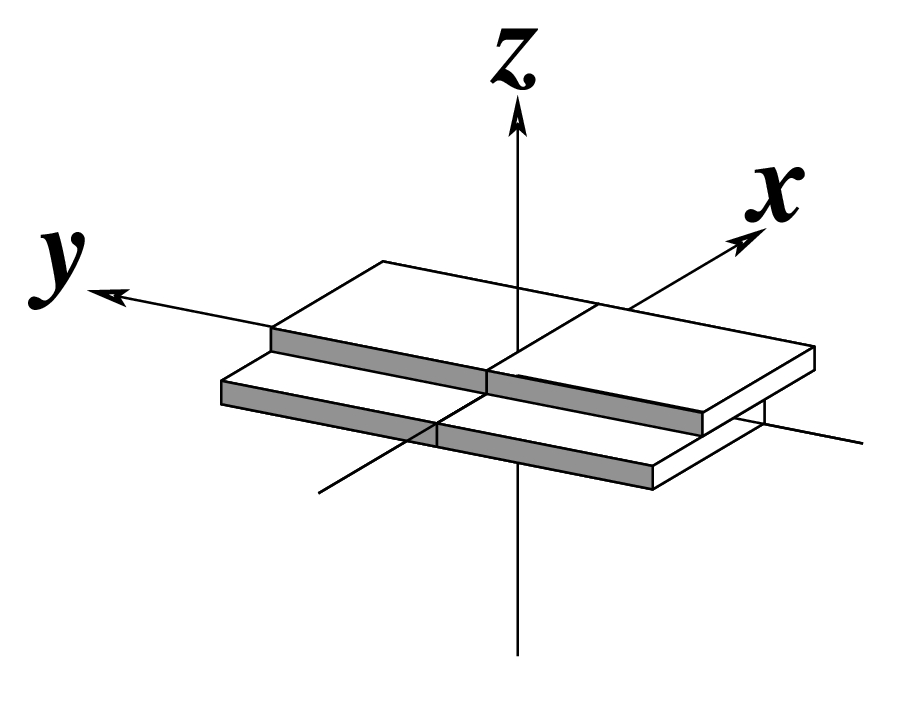
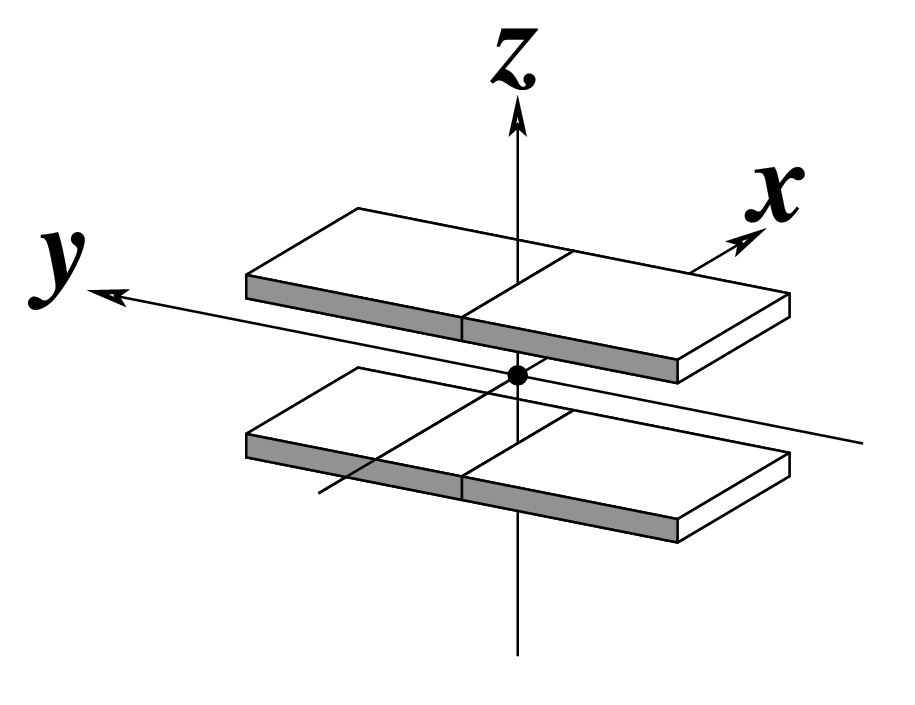
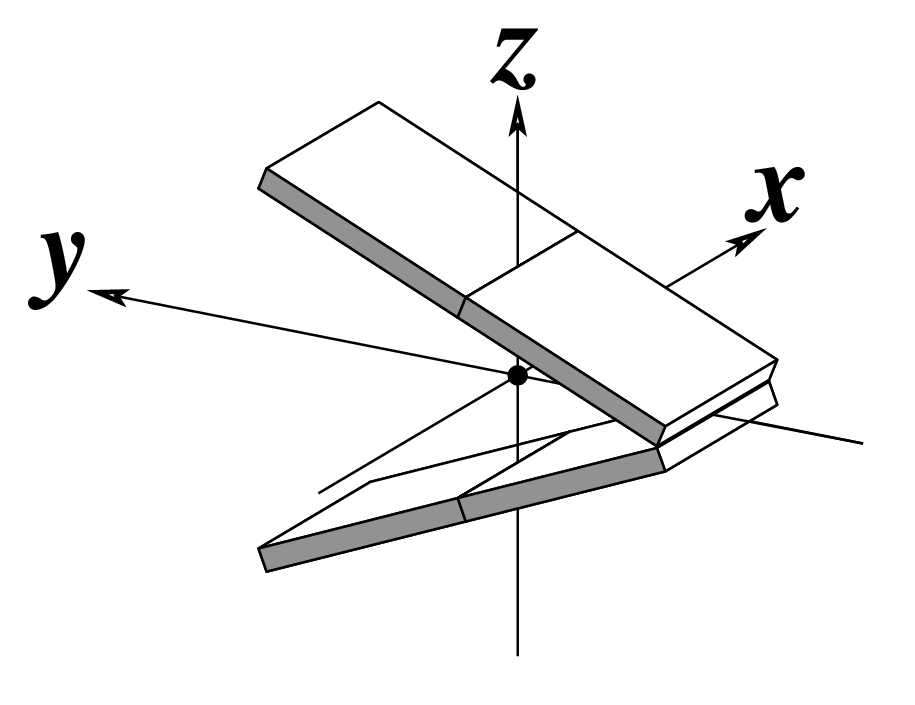
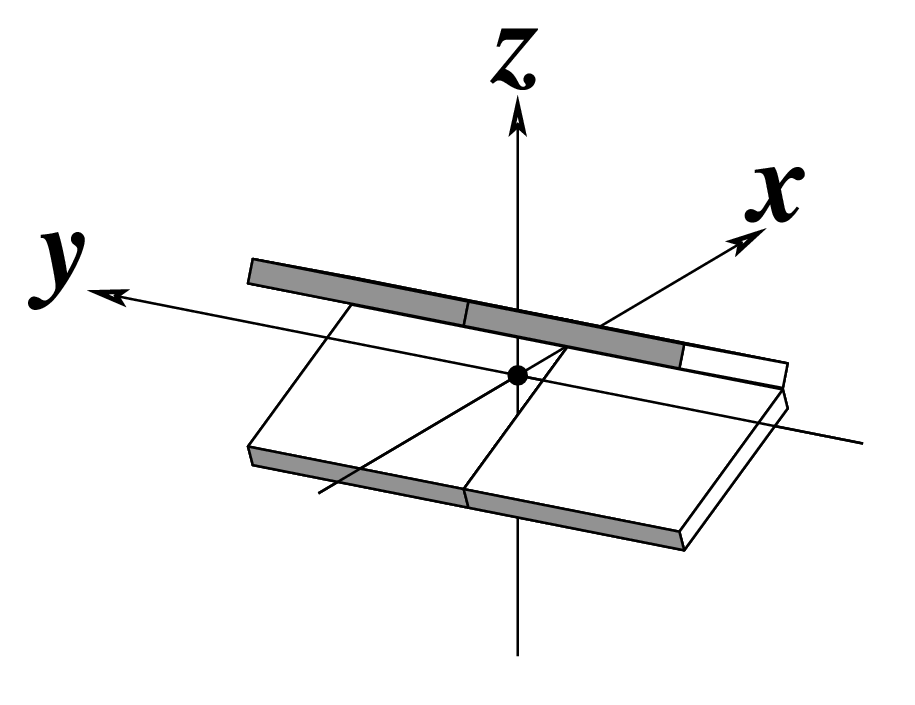
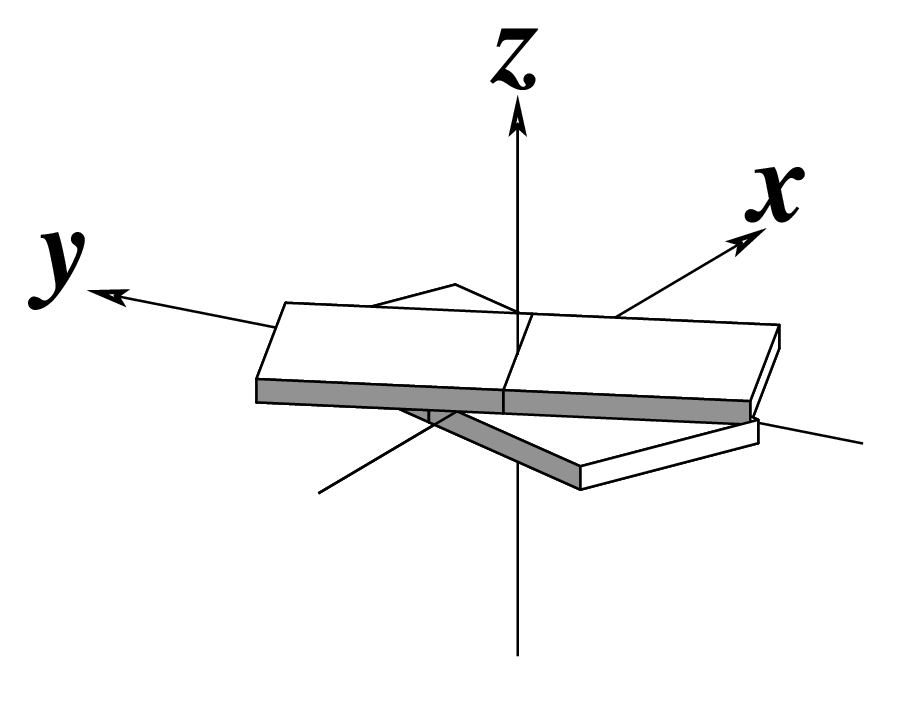
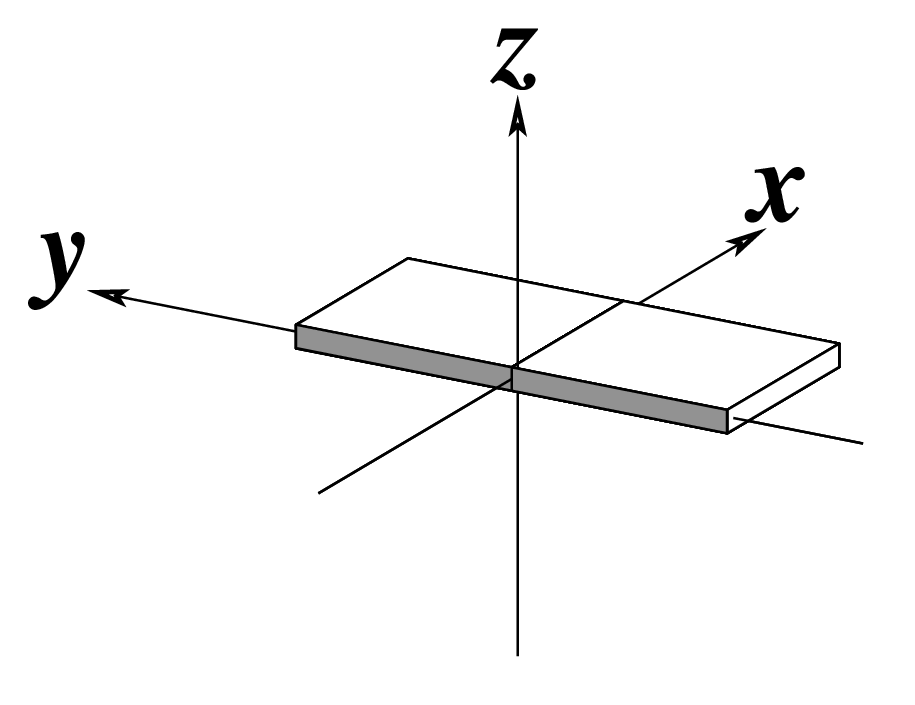
Ever since the 2003 publication of the initial 3DNA Nucleic Acids Research paper (NAR03), the schematic diagrams of base-pair parameters (see figure below) has become quite popular. Over the years, we have received numerous requests for permission to use the figure, or a portion thereof; as an example, the figure has been adopted into a structural biology textbook. In the 2008 3DNA Nature Protocols paper (NP08), we devoted the very first protocol to “create a schematic image for propeller of 45°”.

Figure legend taken from Figure 1 of NAR03: Pictorial definitions of rigid body parameters used to describe the geometry of complementary (or non‐complementary) base pairs and sequential base pair steps (19). The base pair reference frame (lower left) is constructed such that the x‐axis points away from the (shaded) minor groove edge of a base or base pair and the y‐axis points toward the sequence strand (I). The relative position and orientation of successive base pair planes are described with respect to both a dimer reference frame (upper right) and a local helical frame (lower right). Images illustrate positive values of the designated parameters. For illustration purposes, helical twist (Ωh) is the same as Twist (ω), formerly denoted by Ω (19,20) and helical rise (h) is the same as Rise (Dz).
I recall spending around two weeks to produce the above figure. Content-wise, the figure was constructed in only a short while; it was the little details that took me most of the time.
Over time, I’ve witnessed numerous versions of such schematic images in publications related to DNA/RNA structures. While looking similar, the schematics differ subtly in the magnitude, orientation and relative scale of illustrated parameters. To the best of my knowledge, only 3DNA provides a pragmatic approach to generate the base-pair schematic diagrams consistently.
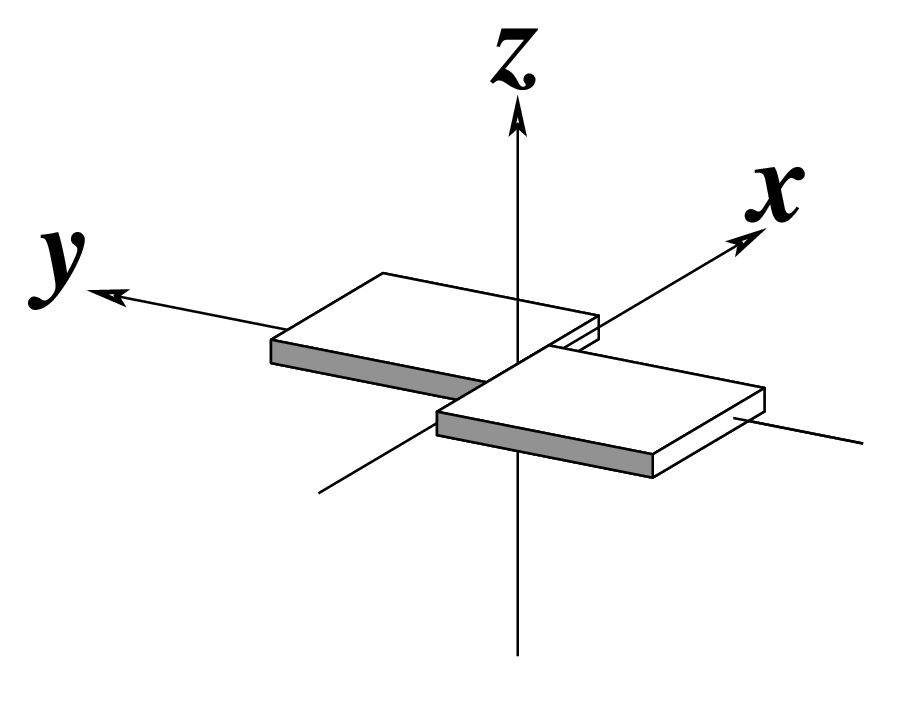
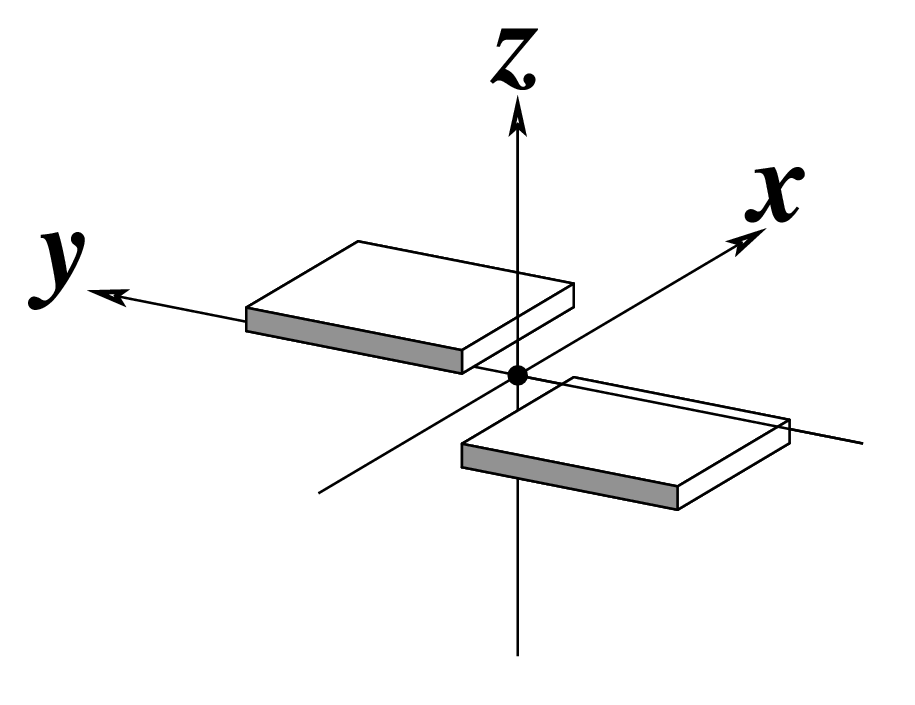
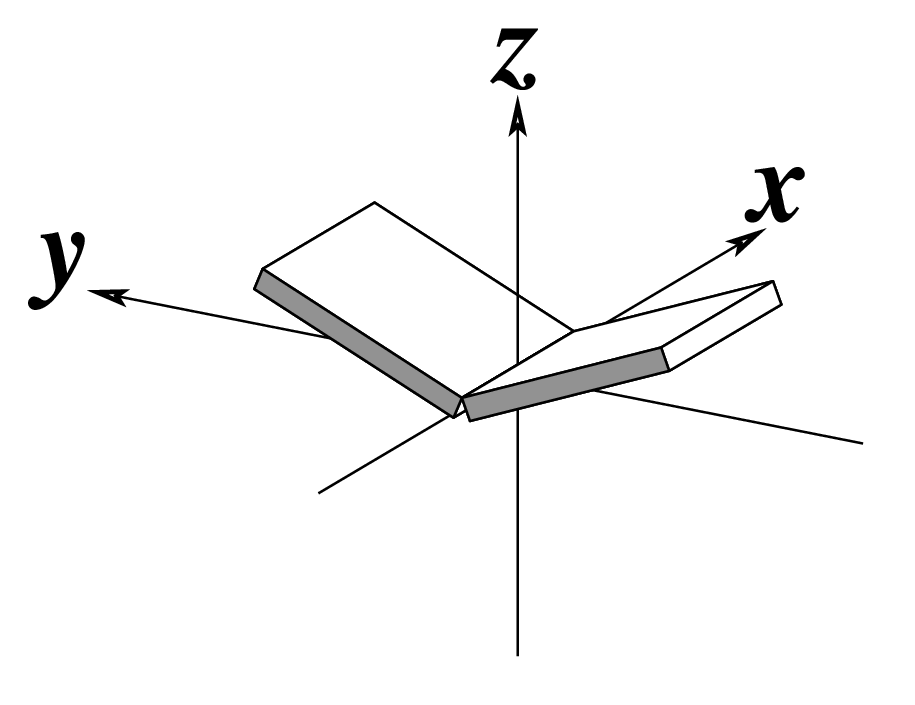
To make the schematics more readily accessible, I’ve reproduced a high resolution image (in png format) for each of the 14 parameters shown above. You are welcome to pick and match the diagrams as necessary. If you use any of them in your publications, please cite the 3DNA NAR03 and/or NP08 paper(s).
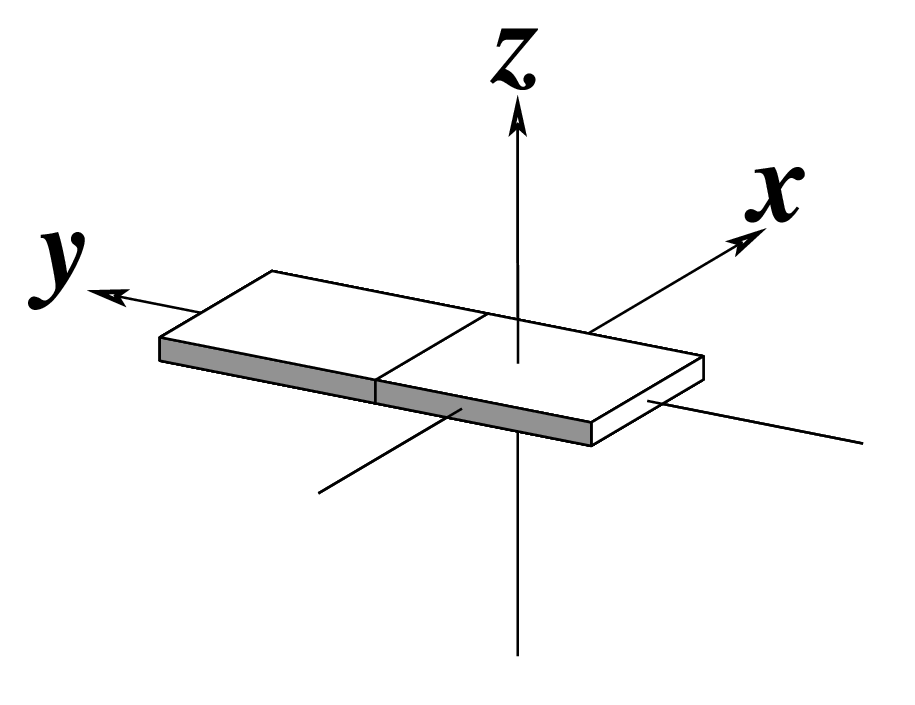
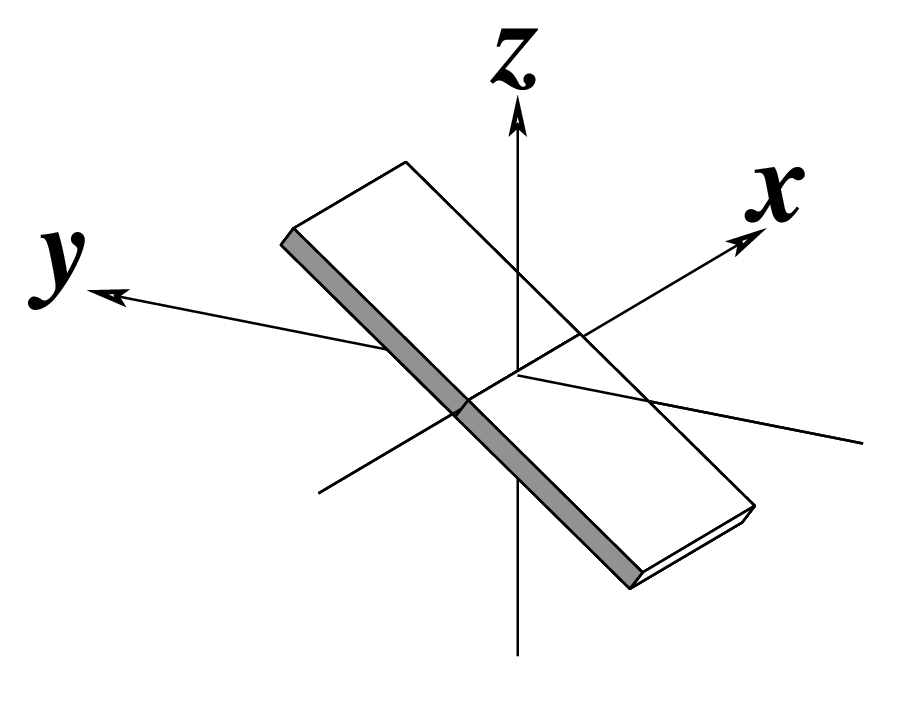
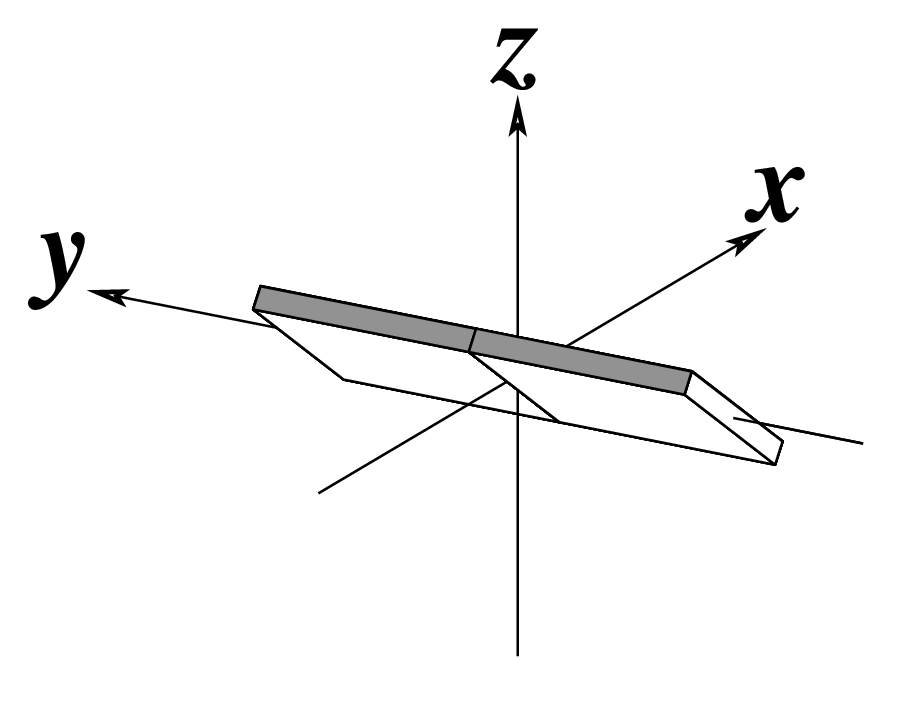
Note that in the schematic diagrams below, the shaded edge (facing the viewer) denotes the minor-groove side of a base or base pair.
| Shear (Sx) |
Stretch (Sy) |
Stagger (Sz) |
 |
 |
 |
| Buckle (κ) |
Propeller (π) |
Opening (σ) |
 |
 |
 |
| Shift (Dx) |
Slide (Dy) |
Rise (Dz) |
 |
 |
 |
| Tilt (τ) |
Roll (ρ) |
Twist (ω) |
 |
 |
 |
| x-displacement (dx) |
y-displacement (dy) |
Helical Rise (h) |
 |
 |
As for Rise above
(for illustration purpose) |
| Inclination (η) |
Tip (θ) |
Helical Twist (Ωh) |
 |
 |
As for Twist above
(for illustration purpose) |

Among the findings of our 2010 Nucleic Acids Research (NAR) article titled The RNA backbone plays a crucial role in mediating the intrinsic stability of the GpU dinucleotide platform and the GpUpA/GpA miniduplex, the key is identifying the O2′(G)…O2P(U) H-bond (see figure below). As noted in a previous post What’s special about the GpU dinucleotide platform?, it was an accidental observation while I was preparing a figure for our 2008 3DNA Nature Protocols paper. Trained as a chemist, after scrutinizing the many occurrances of the GpU platforms in the large ribosomal subunit of Haloarcula marismortui (PDB entry 1jj2), I had no doubt that it is an H-bond. Yet, behind the scene, things were never that straightforward: if it is indeed an H-hbond as we’ve claimed, how could it have been missed altogether by the RNA structural biology community?

Anticipating the potential questions that could be raised by the reviewers, we were extremely careful in characterizing the O2′(G)…O2P(U) H-bond:
- It is formed between the hydroxyl group (donor) of G and a non-bridging phosphate oxygen atom (O2P, acceptor) of U.
- The distance between O2′(G) and O2P(U), 2.68 ± 0.14 Å, is perfect for an H-bond.
- I queried the Cambridge Structure Database for hydroxyl-phosphate H-bonds with similar relative geometry and chemical identity. We found a case in the phospholipid lysophosphatidyl-ethanolamine, where this type of H-bond is highlighted in the abstract: The free glycerol hydroxyl group forms an intramolecular hydrogen bond with a phosphate oxygen and thus affects the conformation and orientation of the head group.
- I also performed a survey of potential O2′(i)…O2P(i+1) H-bonds within dinucleotides regardless of platform configuration, and detected 1186 such pairwise interactions within a distance cutoff of 3.3 Å in RNA crystal structures of 2.5 Å or better resolution.
Careful as we were, we still failed to convince reviewer #3 of our manuscript, which was originally submitted to the RNA journal and finally rejected following the second round of review. Here is an excerpt related to the O2′(G)…O2P(U) H-bond from reviewer #3’s comment:
The first main concern is that the “new” H-bond interaction that the authors propose as an explanation for the greater occurrence of GU platforms versus di-nucleotide combinations does not make much sense on a fundamental chemical and stereo-chemical point of view. Unless the whole community of chemists and biochemists agree to redefine what an H-bond is, the fact that the 2’OH (i) atom is at 2.68 Å from the O2P atom cannot be the only criteria for an H-bond. In fact, if the authors are the first to mention this H-bond, it is because none of the scientists working in RNA structural biology would have considered this to be an H-bond interaction at the first place! H-bonds are known to be very directional. The O2’-H bond should be aligned with one of the electron doublets of O2P to be able to form a proper H-bond. Acceptable variation could be 20° to 30° degree with respect of a straight H-bond interaction, not 90°! The unique paper that the authors cite for justifying their claim cannot be used as a reference. If the authors want to justify that the close proximity of the 2’OH(i) and O2P is the important factor that contributes to preference of GU platforms versus other platforms, they should undergo quantum mechanics calculations to demonstrate it.
This review is so critical that I saw no point in arguing with it — I certainly have neither the power to “redefine what an H-bond is” nor the expertise to perform quantum mechanics (QM) calculations to validate the O2′(G)…O2P(U) H-bond or otherwise. What is compelling to me about the GpU story from the very beginning is that once this sugar-phosphate H-bond is acknowledged, every other parts of our NAR paper follow naturally and logically. Leaving the chicken or the egg issue alone, our work provides a novel perspective about GpU platform’s predominance, the formation of the bulged-G or loop-E motif, the evolutionary co-occurrence of GpUpA and GpA in the GpUpA/GpA miniduplex, and the extreme conservation of GpU observed at most 5′-splice sites. Put another way, we connect the dots to form a coherent picture that is easily understandable to biologists and chemists.
Luckily, after being re-submitted to NAR, the paper was quickly accepted for publication and even selected as a featured article! As another nice surprise, shortly after it was available online as an Advance Access paper, I received an email from Jiri Sponer. Thereafter, we collaborated on a follow-up paper titled Understanding the Sequence Preference of Recurrent RNA Building Blocks Using Quantum Chemistry: The Intrastrand RNA Dinucleotide Platform. While not unexpected, the results of the state-of-the-art QM calculations were nevertheless reassuring:
The mixed-pucker sugar–phosphate backbone conformation found in most GpU platforms, in which the 5′-ribose sugar (G) is in the C2′-endo form and the 3′-sugar (U) in the C3′-endo form, is intrinsically more stable than the standard A-RNA backbone arrangement, partially as a result of a favorable O2′···O2P intraplatform interaction. Our results thus validate the hypothesis of Lu et al. (Lu, X.-J.; et al. Nucleic Acids Res. 2010, 38, 4868–4876) that the superior stability of GpU platforms is partially mediated by the strong O2′···O2P hydrogen bond. …… In contrast, we show that the dinucleotide platform is not properly described in the course of atomistic explicit-solvent simulations. Our work also gives methodological insights into QM calculations of experimental RNA backbone geometries. Such calculations are inherently complicated by rather large data and refinement uncertainties in the available RNA experimental structures, which often preclude reliable energy computations.
So, the O2′(G)…O2P(U) H-bond is more than likely to be real; at least some other scientists working in RNA structural biology do share our view.
See also: What’s special about the GpU dinucleotide platform?

While the Watson-Crick (WC) base pairs (bps) are best-known and most abundant in nucleic acid structures (including RNA), the so-called reverse WC bp variants have received little attention. In the well-established Saenger scheme (see figure below), there are 28 possible bps for A, G, U(T), and C in their cononical (keto- and amino-) tautomeric forms and involving at least two H-bonds. The reverse A·T/U and G·C WC pairs are asymmetric, and are numbered XXI and XXII respectively (middle of right-hand side in the figure below).

In 3DNA, the WC bps are of type M–N and listed as A–T and G–C, consistent with the conventional notation. The reverse WC bps, on the other hand, are of type M+N and listed as A+T and G+C; the ‘+’ signifies the parallel z-axes of the two base reference frames, therefore their dot product is positive (see figure 2 in post Hoogsteen and reverse Hoogsteen base pairs).
As of this writing, a Google search of the phrase “reverse Watson Crick base pair” does not come up with anything informative — the top hit is the Jena Library page titled Nucleic Acid Nomenclature and Structure showing the same set of 28 possible bps only with explicit base chemical structures, as compiled by Tinoco Jr. et al. (1993).
However, once I look into this special type of bps, a quick search in PDB entry 1jj2, the Haloarcula marismortui large ribosomal subunit solved at 2.4 Å resolution, revealed nine reverse WC bps as shown below:
 __U.U..0.205._   __A.A..0.437._   [U+A]
 __C.C..0.1186._  __G.G..0.1190._  [C+G]
 __C.C..0.1377._  __G.G..0.1683._  [C+G]
 __C.C..0.1856._  __G.G..0.1873._  [C+G]
 __A.A..0.2054._  __U.U..0.2648._  [A+U]
 __U.U..0.2109._  __A.A..0.2467._  [U+A]
 __A.A..0.2301._  __U.U..0.2306._  [A+U]
 __A.A..0.2321._  __U.U..0.2378._  [A+U]
 __C.C..0.2510._  __G.G..0.2564._  [C+G]
The following figure shows a representative reverse WC A+U bp (0.A437 with 0.U205, top), and a representative reverse WC G+C bp (0.G1683 with 0.C1377, bottom). For easy comparison, the two reverse WC bps are orientated in the reference frames of A and G, respectively.
In future releases of 3DNA, presumably starting from v2.2, we plan to provide a new component to classify bps according to the Saenger scheme, the Leontis/Westhof notation, and the geometric parameter-based strategy. Overall, the three bp classification methods are complementary in functionality, but with increased sophistication and applicability.


