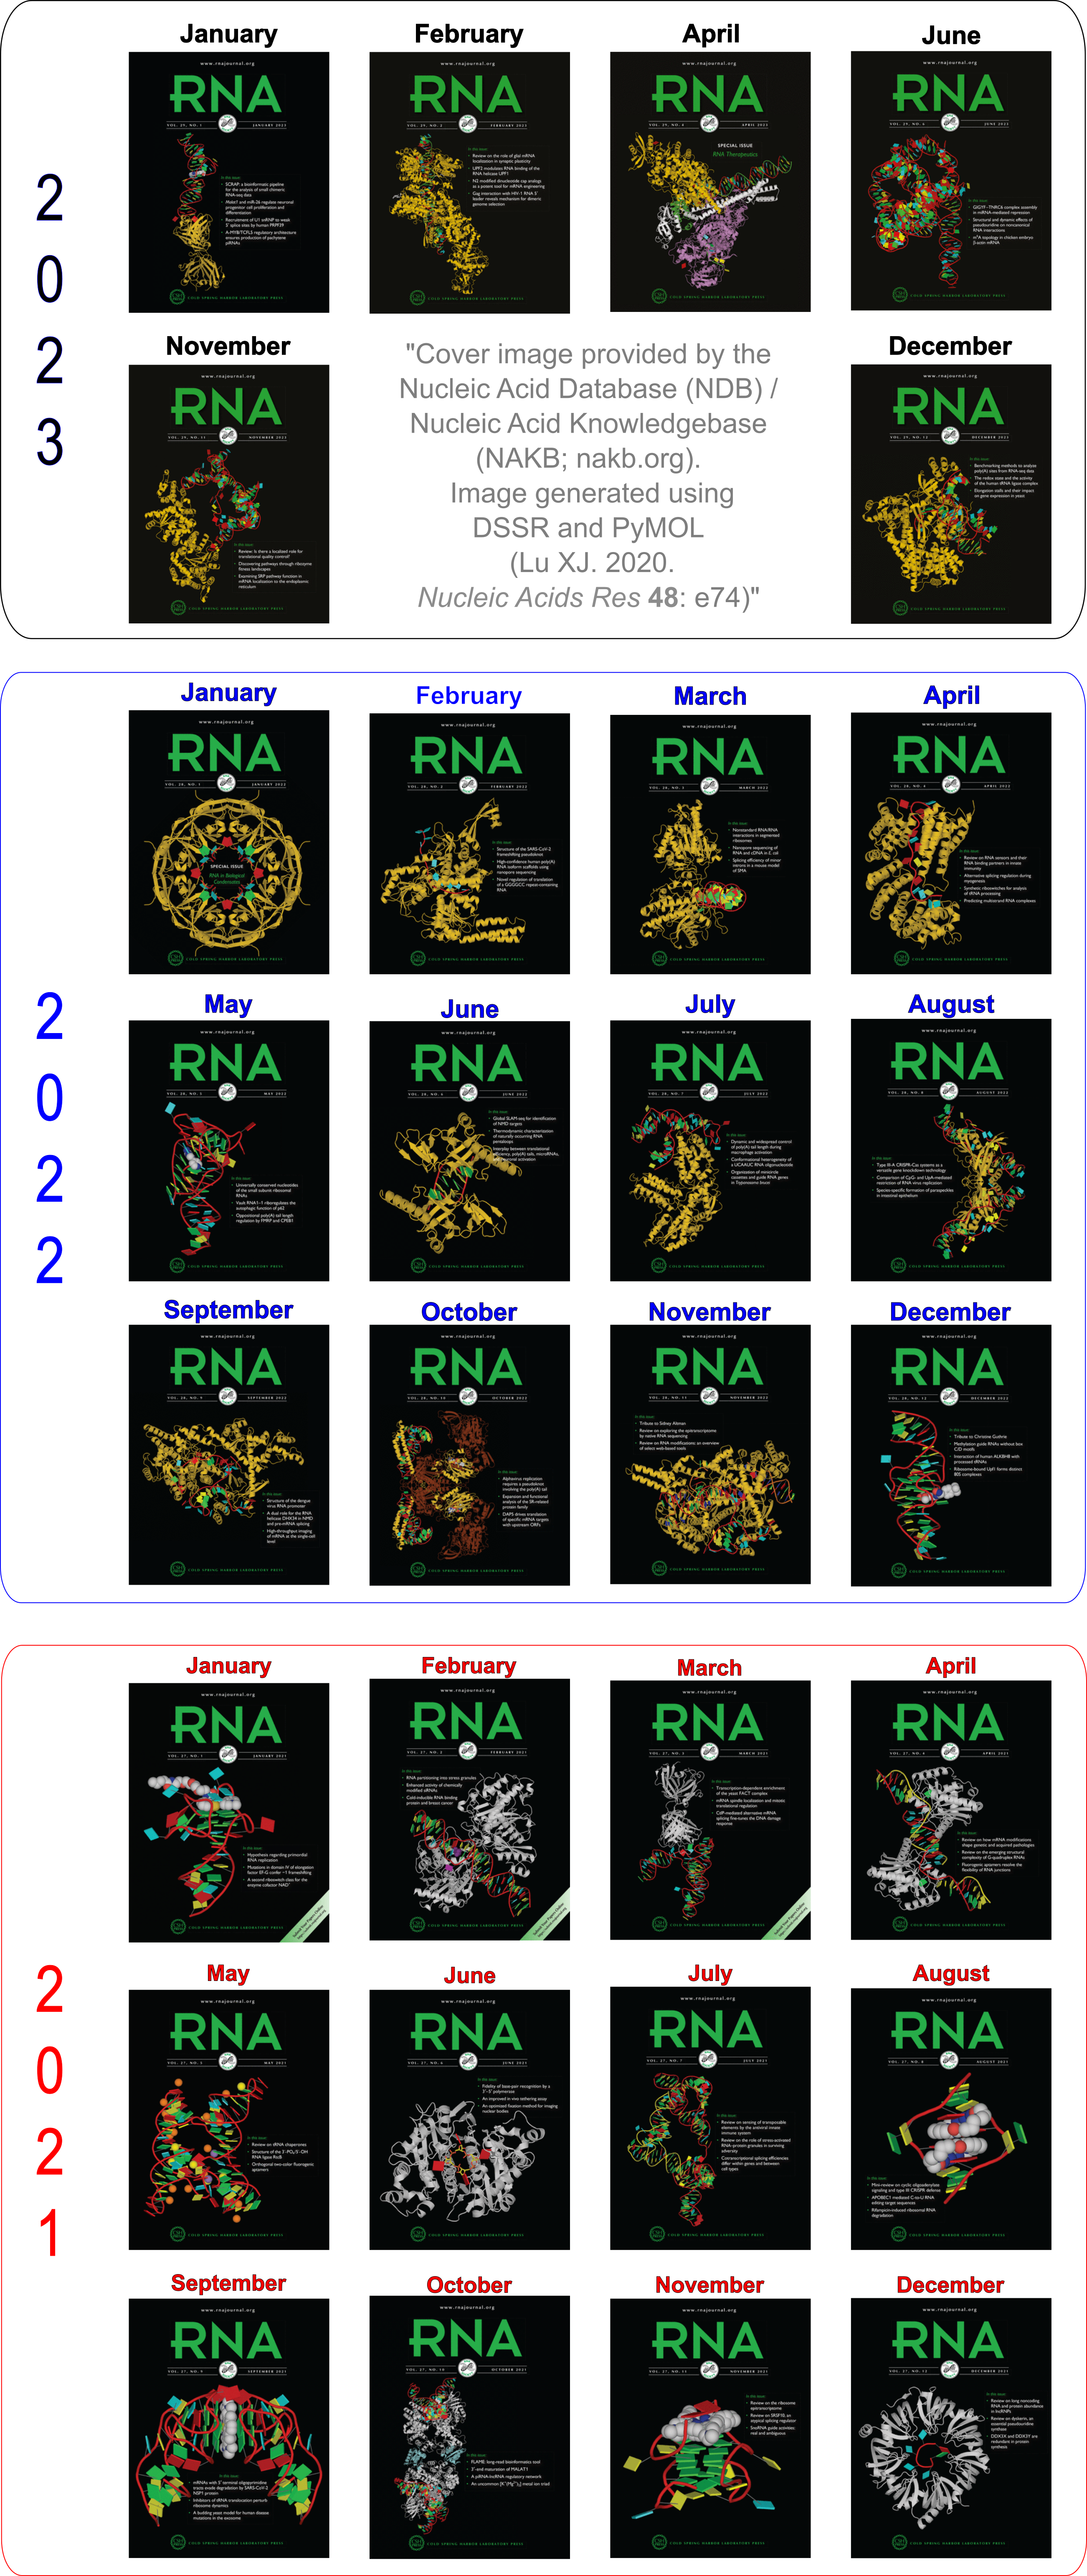
Cover image provided by X3DNA-DSSR, an NIGMS National Resource for structural bioinformatics of nucleic acids (R24GM153869; skmatics.x3dna.org). Image generated using DSSR and PyMOL (Lu XJ. 2020. [Nucleic Acids Res 48: e74(https://doi.org/10.1093/nar/gkaa426)).
See the 2020 paper titled "DSSR-enabled innovative schematics of 3D nucleic acid structures with PyMOL" in Nucleic Acids Research and the corresponding Supplemental PDF for details. Many thanks to Drs. Wilma Olson and Cathy Lawson for their help in the preparation of the illustrations.
Details on how to reproduce the cover images are available on the 3DNA Forum.

Structure of a group II intron ribonucleoprotein in the pre-ligation state (PDB id: 8T2R; Xu L, Liu T, Chung K, Pyle AM. 2023. Structural insights into intron catalysis and dynamics during splicing. Nature 624: 682–688). The pre-ligation complex of the Agathobacter rectalis group II intron reverse transcriptase/maturase with intron and 5′-exon RNAs makes it possible to construct a picture of the splicing active site. The intron is depicted by a green ribbon, with bases and Watson-Crick base pairs represented as color-coded blocks: A/A-U in red, C/C-G in yellow, G/G-C in green, U/U-A in cyan; the 5′-exon is shown by white spheres and the protein by a gold ribbon. Cover image provided by X3DNA-DSSR, an NIGMS National Resource for structural bioinformatics of nucleic acids (R24GM153869; skmatics.x3dna.org). Image generated using DSSR and PyMOL (Lu XJ. 2020. Nucleic Acids Res 48: e74).

Complex of terminal uridylyltransferase 7 (TUT7) with pre-miRNA and Lin28A (PDB id: 8OPT; Yi G, Ye M, Carrique L, El-Sagheer A, Brown T, Norbury CJ, Zhang P, Gilbert RJ. 2024. Structural basis for activity switching in polymerases determining the fate of let-7 pre-miRNAs. Nat Struct Mol Biol 31: 1426–1438). The RNA-binding pluripotency factor LIN28A invades and melts the RNA and affects the mechanism of action of the TUT7 enzyme. The RNA backbone is depicted by a red ribbon, with bases and Watson-Crick base pairs represented as color-coded blocks: A/A-U in red, C/C-G in yellow, G/G-C in green, U/U-A in cyan; TUT7 is represented by a gold ribbon and LIN28A by a white ribbon. Cover image provided by X3DNA-DSSR, an NIGMS National Resource for structural bioinformatics of nucleic acids (R24GM153869; skmatics.x3dna.org). Image generated using DSSR and PyMOL (Lu XJ. 2020. Nucleic Acids Res 48: e74).

Cryo-EM structure of the pre-B complex (PDB id: 8QP8; Zhang Z, Kumar V, Dybkov O, Will CL, Zhong J, Ludwig SE, Urlaub H, Kastner B, Stark H, Lührmann R. 2024. Structural insights into the cross-exon to cross-intron spliceosome switch. Nature 630: 1012–1019). The pre-B complex is thought to be critical in the regulation of splicing reactions. Its structure suggests how the cross-exon and cross-intron spliceosome assembly pathways converge. The U4, U5, and U6 snRNA backbones are depicted respectively by blue, green, and red ribbons, with bases and Watson-Crick base pairs shown as color-coded blocks: A/A-U in red, C/C-G in yellow, G/G-C in green, U/U-A in cyan; the proteins are represented by gold ribbons. Cover image provided by X3DNA-DSSR, an NIGMS National Resource for structural bioinformatics of nucleic acids (R24GM153869; skmatics.x3dna.org). Image generated using DSSR and PyMOL (Lu XJ. 2020. Nucleic Acids Res 48: e74).

Structure of the Hendra henipavirus (HeV) nucleoprotein (N) protein-RNA double-ring assembly (PDB id: 8C4H; Passchier TC, White JB, Maskell DP, Byrne MJ, Ranson NA, Edwards TA, Barr JN. 2024. The cryoEM structure of the Hendra henipavirus nucleoprotein reveals insights into paramyxoviral nucleocapsid architectures. Sci Rep 14: 14099). The HeV N protein adopts a bi-lobed fold, where the N- and C-terminal globular domains are bisected by an RNA binding cleft. Neighboring N proteins assemble laterally and completely encapsidate the viral genomic and antigenomic RNAs. The two RNAs are depicted by green and red ribbons. The U bases of the poly(U) model are shown as cyan blocks. Proteins are represented as semitransparent gold ribbons. Cover image provided by X3DNA-DSSR, an NIGMS National Resource for structural bioinformatics of nucleic acids (R24GM153869; skmatics.x3dna.org). Image generated using DSSR and PyMOL (Lu XJ. 2020. Nucleic Acids Res 48: e74).

Structure of the helicase and C-terminal domains of Dicer-related helicase-1 (DRH-1) bound to dsRNA (PDB id: 8T5S; Consalvo CD, Aderounmu AM, Donelick HM, Aruscavage PJ, Eckert DM, Shen PS, Bass BL. 2024. Caenorhabditis elegans Dicer acts with the RIG-I-like helicase DRH-1 and RDE-4 to cleave dsRNA. eLife 13: RP93979. Cryo-EM structures of Dicer-1 in complex with DRH-1, RNAi deficient-4 (RDE-4), and dsRNA provide mechanistic insights into how these three proteins cooperate in antiviral defense. The dsRNA backbone is depicted by green and red ribbons. The U-A pairs of the poly(A)·poly(U) model are shown as long rectangular cyan blocks, with minor-groove edges colored white. The ADP ligand is represented by a red block and the protein by a gold ribbon. Cover image provided by X3DNA-DSSR, an NIGMS National Resource for structural bioinformatics of nucleic acids (R24GM153869; skmatics.x3dna.org). Image generated using DSSR and PyMOL (Lu XJ. 2020. Nucleic Acids Res 48: e74).
Moreover, the following 30 [12(2021) + 12(2022) + 6(2023)] cover images of the RNA Journal were generated by the NAKB (nakb.org).
Cover image provided by the Nucleic Acid Database (NDB)/Nucleic Acid Knowledgebase (NAKB; nakb.org). Image generated using DSSR and PyMOL (Lu XJ. 2020. Nucleic Acids Res 48: e74).
From early on, DSSR-derived RNA secondary structures in dot-bracket notation (dbn) have taken pseudoknots into consideration. Nevertheless, in DSSR releases prior to v1.1.3-2014jun18, the dbn output had been simplified to the first level only, with matched []s, even for RNA structures with high-order pseudoknots. RNA pseudoknot is a (relatively) complicated issue, and I’d planned to put off the topic until DSSR is well-established.
In early May, I noticed the Antczak et al. article RNApdbee—a webserver to derive secondary structures from pdb files of knotted and unknotted RNAs. I was delighted to read the following citation:
In order to facilitate a more comprehensive study, the webserver integrates the functionality of RNAView, MC-Annotate and 3DNA/DSSR, being the most common tools used for automated identification and classification of RNA base pairs.
Even before any paper on DSSR has been published, the software has already be ranked in the top three for the identification and classification of RNA base pairs! Well familiar with RNAView and MC-Annotate, I am glad to see DSSR is now listed on a par with them. Note that DSSR has far more functionality than just identifying and classifying RNA base pairs.
Further down the RNApdbee paper, especially in Figure 2, I found the following remarks regarding DSSR’s capability on RNA structures with high-order pseudoknot.

An arc diagram to represent the secondary structure of 1DDY (chain A) generated by R-CHIE upon the dot-bracket notation. Arcs of the same colour define a paired region. Crossing arcs reflect a conflict observed between the corresponding regions. (a) RNApdbee recognizes pseudoknots of the first (dark green) and second (navy blue) order. (b) 3DNA/DSSR improperly classifies base pairs (within residues in red) and the structure is recognized as the first-order pseudoknot.
The above citation and the question Higher-order pseudoknots in DP output (from Jan Hajic, Charles University in Prague) on the 3DNA Forum prompted me to further refine DSSR’s algorithm for deriving secondary structures of RNA with high-order pseudoknots. The DSSR v1.1.3-2014jun18 release made this revised functionality explicit. For the above cited PDB entry 1ddy, the relevant output of running DSSR on it would be:
Running command: "x3dna-dssr -i=1ddy.pdb"

****************************************************************************
This structure contains 2-order pseudoknot(s)

****************************************************************************
Secondary structures in dot-bracket notation (dbn) as a whole and per chain
>1ddy nts=140 [whole]
GGAACCGGUGCGCAUAACCACCUCAGUGCGAGCAA&GGAACCGGUGCGCAUAACCACCUCAGUGCGAGCAA&GGAACCGGUGCGCAUAACCACCUCAGUGCGAGCAA&GGAACCGGUGCGCAUAACCACCUCAGUGCGAGCAA
......(((.{[[....[[)))...].].}.]]..&......(((.{[[....[[)))...].].}.]]..&......(((.{[[....[[)))...].].}.]]..&......(((.{[[....[[)))...].].}.]]..
>1ddy-A #1 nts=35 [chain] RNA
GGAACCGGUGCGCAUAACCACCUCAGUGCGAGCAA
......(((.{[[....[[)))...].].}.]]..
>1ddy-C #2 nts=35 [chain] RNA
GGAACCGGUGCGCAUAACCACCUCAGUGCGAGCAA
......(((.{[[....[[)))...].].}.]]..
>1ddy-E #3 nts=35 [chain] RNA
GGAACCGGUGCGCAUAACCACCUCAGUGCGAGCAA
......(((.{[[....[[)))...].].}.]]..
>1ddy-G #4 nts=35 [chain] RNA
GGAACCGGUGCGCAUAACCACCUCAGUGCGAGCAA
......(((.{[[....[[)))...].].}.]]..
Note that the whole 1ddy entry contains four RNA chains (A, C, E, and G), and DSSR can handle each properly. So at least from DSSR v1.1.3-2014jun18, the following statement is no longer valid:
3DNA/DSSR improperly classifies base pairs (within residues in red) and the structure is recognized as the first-order pseudoknot.
A closely related issue is knot removal, a topic nicely summarized by Smit et al. in their publication From knotted to nested RNA structures: A variety of computational methods for pseudoknot removal. While not explicitly documented, the --nested (abbreviated to --nest) option has been available since DSSR v1.1.3-2014jun18. This option was first mentioned in the release note of DSSR v1.1.4-2014aug09. Again, using PDB entry 1ddy as an example, the relevant output of running DSSR with option --nested is as follows:
Running command: "x3dna-dssr -i=1ddy.pdb --nested"

****************************************************************************
This structure contains 2-order pseudoknot(s)
   o You've chosen to remove pseudo-knots, leaving only nested pairs

****************************************************************************
Secondary structures in dot-bracket notation (dbn) as a whole and per chain
>1ddy nts=140 [whole]
GGAACCGGUGCGCAUAACCACCUCAGUGCGAGCAA&GGAACCGGUGCGCAUAACCACCUCAGUGCGAGCAA&GGAACCGGUGCGCAUAACCACCUCAGUGCGAGCAA&GGAACCGGUGCGCAUAACCACCUCAGUGCGAGCAA
......(((..........))).............&......(((..........))).............&......(((..........))).............&......(((..........))).............
>1ddy-A #1 nts=35 [chain] RNA
GGAACCGGUGCGCAUAACCACCUCAGUGCGAGCAA
......(((..........))).............
>1ddy-C #2 nts=35 [chain] RNA
GGAACCGGUGCGCAUAACCACCUCAGUGCGAGCAA
......(((..........))).............
>1ddy-E #3 nts=35 [chain] RNA
GGAACCGGUGCGCAUAACCACCUCAGUGCGAGCAA
......(((..........))).............
>1ddy-G #4 nts=35 [chain] RNA
GGAACCGGUGCGCAUAACCACCUCAGUGCGAGCAA
......(((..........))).............

H-bonding interactions are crucial for defining RNA secondary and tertiary structures. DSSR/3DNA contains a geometrically based algorithm for identifying H-bonds in nucleic-acid or protein structures given in .pdb or .cif format. Over the years, the method has been continuously refined, and it has served its purpose quite well. As of v1.1.1-2014apr11, this functionality is directly available from DSSR thorough the --get-hbonds option.
The output for 1msy, which contains a GUAA tetraloop mutant of Sarcin/Ricin domain from E. Coli 23 S rRNA, is listed below. The first line gives the header (# H-bonds in '1msy.pdb' identified by DSSR ...). The second line provides the total number of H-bonds (40) identified in the structure. Afterwards, each line consists of 8 space-delimited columns used to characterize a specific H-bond. Using the first one (#1) as an example, the meaning of each of the 8 columns is:
- The serial number (15), as denoted in the .pdb or .cif file, of the first atom of the H-bond.
- The serial number (578) of the second H-bond atom.
- The H-bond index (#1), from 1 to the total number of H-bonds.
- A one-letter symbol showing the atom-pair type (p) of the H-bond. It is ‘p’ for a donor-acceptor atom pair; ‘o’ for a donor/acceptor (such as the 2′-hydorxyl oxygen) with any other atom; ‘x’ for a donor-donor or acceptor-acceptor pair (as in #17); ‘?’ if the donor/acceptor status is unknown for any H-bond atom.
- Distance in Å between donor/acceptor atoms (2.768).
- Elemental symbols of the two atoms involved in the H-bond (O/N).
- Identifier of the first H-bond atom (O4@A.U2647).
- Identifier of the second H-bond atom (N1@A.G2673).
Command: x3dna-dssr -i=1msy.pdb --get-hbonds –o=1msy-hbonds.txt

# H-bonds in '1msy.pdb' identified by 3DNA version 3 (xiangjun@x3dna.org)
40
   15   578  #1     p    2.768 O:N O4@A.U2647 N1@A.G2673
   35   555  #2     p    2.776 O:N O6@A.G2648 N3@A.U2672
   36   554  #3     p    2.826 N:O N1@A.G2648 O2@A.U2672
   55   537  #4     p    2.965 O:N O2@A.C2649 N2@A.G2671
   56   535  #5     p    2.836 N:N N3@A.C2649 N1@A.G2671
   58   534  #6     p    2.769 N:O N4@A.C2649 O6@A.G2671
   76   513  #7     p    2.806 N:N N3@A.U2650 N1@A.A2670
   78   512  #8     p    3.129 O:N O4@A.U2650 N6@A.A2670
   95   492  #9     p    2.703 O:N O2@A.C2651 N2@A.G2669
   96   490  #10    p    2.853 N:N N3@A.C2651 N1@A.G2669
   98   489  #11    p    2.987 N:O N4@A.C2651 O6@A.G2669
  115   466  #12    p    2.817 O:N O2@A.C2652 N2@A.G2668
  116   464  #13    p    2.907 N:N N3@A.C2652 N1@A.G2668
  118   463  #14    p    2.897 N:O N4@A.C2652 O6@A.G2668
  123   151  #15    o    2.622 O:O OP2@A.U2653 O2'@A.A2654
  135   443  #16    p    2.898 O:N O2@A.U2653 N4@A.C2667
  147   192  #17    x    3.054 O:O O4'@A.A2654 O4'@A.U2656
  158   408  #18    p    2.960 N:O N6@A.A2654 OP2@A.C2666
  173   188  #19    o    2.923 O:O O2'@A.G2655 OP2@A.U2656
  173   378  #20    o    3.093 O:O O2'@A.G2655 O6@A.G2664
  173   379  #21    o    3.343 O:N O2'@A.G2655 N1@A.G2664
  181   386  #22    p    2.768 N:O N1@A.G2655 OP2@A.A2665
  183   203  #23    p    2.754 N:O N2@A.G2655 O4@A.U2656
  183   387  #24    p    2.887 N:O N2@A.G2655 O5'@A.A2665
  188   379  #25    p    3.044 O:N OP2@A.U2656 N1@A.G2664
  188   381  #26    p    2.944 O:N OP2@A.U2656 N2@A.G2664
  200   401  #27    p    3.122 O:N O2@A.U2656 N6@A.A2665
  201   398  #28    p    2.759 N:N N3@A.U2656 N7@A.A2665
  220   381  #29    p    3.035 N:N N7@A.A2657 N2@A.G2664
  223   371  #30    o    2.963 N:O N6@A.A2657 O2'@A.G2664
  223   382  #31    p    3.039 N:N N6@A.A2657 N3@A.G2664
  242   358  #32    p    2.821 O:N O2@A.C2658 N2@A.G2663
  243   356  #33    p    2.890 N:N N3@A.C2658 N1@A.G2663
  245   355  #34    p    2.887 N:O N4@A.C2658 O6@A.G2663
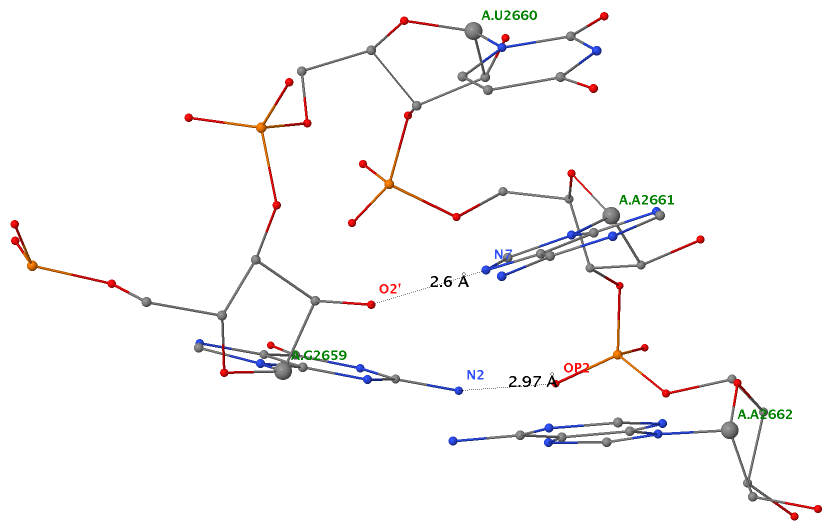
  258   305  #35    o    2.604 O:N O2'@A.G2659 N7@A.A2661
  258   308  #36    o    3.264 O:N O2'@A.G2659 N6@A.A2661
  268   315  #37    p    2.973 N:O N2@A.G2659 OP2@A.A2662
  268   327  #38    p    2.864 N:N N2@A.G2659 N7@A.A2662
  371   390  #39    o    2.751 O:O O2'@A.G2664 O4'@A.A2665
  550   566  #40    o    3.372 O:O O2'@A.U2672 O4'@A.G2673
In its default settings, DSSR detects 117 H-bonds for 1ehz (yeast phenylalanine tRNA), and 5,809 for 1jj2 (the H. marismortui large ribosomal subunit). Note that the program can identify H-bonds not only in RNA and DNA, but also in proteins, or their complexes. By default, however, DSSR only reports H-bonds within nucleic acids. As shown above, it is trivial to run DSSR with the --get-hbonds option to get all H-bonds in a given structure, and the plain text output is straightforward to work on.
While there exist dedicated tools for finding H-bonds, such as HBPLUS or HBexplore, DSSR may well be sufficient to fulfill most practical needs. If you notice any weird behaviors with this H-bond finding functionality, please let me know. I strive to address reported issues promptly, to the extent practical. At the very least, I should be able to explain why the program is working the way it does.

As of v1.0.3-2014mar09, DSSR has a decent user manual in PDF! Currently of 45 pages long, the DSSR manual contains everything a typical user needs to know to get started using the program effectively. The contents the manual are listed below.
Table of Contents

List of Figures

Introduction

Download and installation

Usages
  Command-line help
  Default run on PDB entry 1msy – detailed explanations
    Summary section
    List of base pairs
    List of multiplets
    List of helices
    List of stems
    List of lone canonical pairs
    List of various loops
    List of single-stranded fragments
    Secondary structure in dot-bracket notation
    List of backbone torsion angles and suite names
  Default run on PDB entry 1ehz (tRNAPhe) – summary notes
    Brief summary
    Specific features
  Default run on PDB entry 1jj2 – four auto-checked motifs
    Kissing loops
    A-minor (types I and II) motifs
    Ribose zippers
    Kink turns
  The --more option
    Extra parameters for base pairs
    Extra parameters for helices/stems
  The –-non-pair option
  The –-u-turn option
  The --po4 option
  The –-long-idstr option

Frequently asked questions
  How to cite DSSR?
  Does DSSR work for DNA?
  Does DSSR detect RNA tertiary interactions?

Revision history

Acknowledgements

References
With the User Manual available, I feel confident to claim that DSSR is now mature, stable, ready for real world applications. While only time would tell, I have no doubt that DSSR will become an essential tool in RNA structural bioinformatics.

From early on, DSSR-derived nucleic acid secondary structures have been written in the compact dot-bracket notation (.dbn) with pseudo-knot information. To better connect DSSR to the 2D world, I recently looked into the connect (.ct) format, which was first introduced by Zuker’s mfold program. Over time, the .ct format has become one of the most commonly used RNA secondary structure formats, and it is more expressive than the .dbn format (see below).
As of v1.0, for each analyzed structure, DSSR produces two secondary structure files with default names dssr-2ndstrs.dbn and dssr-2ndstrs.ct, in .dbn and .ct formats, respectively. Using the 27-nucleotides (nt) RNA fragment 1msy as an example, the DSSR-derived secondary structure in .dbn and .ct formats are shown below:
![1msy [GUAA tetra loop] in 3d and 2d representations 1msy [GUAA tetra loop] in 3d and 2d representations](http://forum.x3dna.org/images/1msy-3d-2d.png)
In dot-bracket notation (.dbn) [dssr-2ndstrs.dbn]
------------------------------------------------------
>1msy nts=27 DSSR-derived secondary structure
UGCUCCUAGUACGUAAGGACCGGAGUG
.(((((.....(....)....))))).
------------------------------------------------------

In connect format (.ct) [dssr-2ndstrs.ct]
------------------------------------------------------
   27 DSSR-derived secondary structure in '1msy'
    1 U     0     2     0  2647 # name=A.U2647
    2 G     1     3    26  2648 # name=A.G2648, pairedNt=A.U2672
    3 C     2     4    25  2649 # name=A.C2649, pairedNt=A.G2671
    4 U     3     5    24  2650 # name=A.U2650, pairedNt=A.A2670
    5 C     4     6    23  2651 # name=A.C2651, pairedNt=A.G2669
    6 C     5     7    22  2652 # name=A.C2652, pairedNt=A.G2668
    7 U     6     8     0  2653 # name=A.U2653
    8 A     7     9     0  2654 # name=A.A2654
    9 G     8    10     0  2655 # name=A.G2655
   10 U     9    11     0  2656 # name=A.U2656
   11 A    10    12     0  2657 # name=A.A2657
   12 C    11    13    17  2658 # name=A.C2658, pairedNt=A.G2663
   13 G    12    14     0  2659 # name=A.G2659
   14 U    13    15     0  2660 # name=A.U2660
   15 A    14    16     0  2661 # name=A.A2661
   16 A    15    17     0  2662 # name=A.A2662
   17 G    16    18    12  2663 # name=A.G2663, pairedNt=A.C2658
   18 G    17    19     0  2664 # name=A.G2664
   19 A    18    20     0  2665 # name=A.A2665
   20 C    19    21     0  2666 # name=A.C2666
   21 C    20    22     0  2667 # name=A.C2667
   22 G    21    23     6  2668 # name=A.G2668, pairedNt=A.C2652
   23 G    22    24     5  2669 # name=A.G2669, pairedNt=A.C2651
   24 A    23    25     4  2670 # name=A.A2670, pairedNt=A.U2650
   25 G    24    26     3  2671 # name=A.G2671, pairedNt=A.C2649
   26 U    25    27     2  2672 # name=A.U2672, pairedNt=A.G2648
   27 G    26     0     0  2673 # name=A.G2673
------------------------------------------------------
Presumably, the .ct format is very simple, and examining a sample file as shown above would give one a pretty good sense of what each column is about. While there exist many oversimplified descriptions of the .ct format on the web, the most detailed and accurate explanation is from the mfold manual:
The ``ct’‘ file (connect table) contains the sequence and base pair information, and is meant to be an input file for a structure drawing program. In addition to containing base pair information, it also lists the 5′ and 3′ neighbor of each base, allowing for the representation of circular RNA or multiple molecules. The ct file also lists the historical base numbering in the original sequence, as bases and base pairs are numbered according from 1 to the size of the folded segment. A portion of a ct file is displayed in Figure 12.
Figure 12: The ct file for the second and final folding of S. cerevisiae Phe-tRNA at 37°, with default parameters. The first record displays the fragment size (76), ΔG and sequence name. The ith subsequent record contains, in order, i, ri, the index of the 5′-connecting base, the index of the 3′-connecting base, the index of the paired base and the historical numbering of the ith base in the original sequence. The 5′, 3′ and base pair indices are 0 when there is no connection or base pair.
Specifically, the 3rd, 4th, and 6th columns in the .ct format convey specific information; by design, they are not redundant to information contained in the 1st column. Note that in the above ‘1msy’ example, the 6th column gives the nt sequence numbers (as in the PDB datafile) instead of the serial numbers (as in the 1st column). The DSSR produced .ct files also contain extra information after ‘#’, in the comma separated key=value format.
As an example of the usefulness of the 3rd and 4th columns, have a look of the DSSR-derived .ct file for the Dickerson DNA dodecamer duplex with sequence CGCGAATTCGCG:
   24 DSSR-derived secondary structure in '355d'
    1 C     0     2    24     1 # name=A.DC1, pairedNt=B.DG24
    2 G     1     3    23     2 # name=A.DG2, pairedNt=B.DC23
    3 C     2     4    22     3 # name=A.DC3, pairedNt=B.DG22
    4 G     3     5    21     4 # name=A.DG4, pairedNt=B.DC21
    5 A     4     6    20     5 # name=A.DA5, pairedNt=B.DT20
    6 A     5     7    19     6 # name=A.DA6, pairedNt=B.DT19
    7 T     6     8    18     7 # name=A.DT7, pairedNt=B.DA18
    8 T     7     9    17     8 # name=A.DT8, pairedNt=B.DA17
    9 C     8    10    16     9 # name=A.DC9, pairedNt=B.DG16
   10 G     9    11    15    10 # name=A.DG10, pairedNt=B.DC15
   11 C    10    12    14    11 # name=A.DC11, pairedNt=B.DG14
   12 G    11     0    13    12 # name=A.DG12, pairedNt=B.DC13
   13 C     0    14    12    13 # name=B.DC13, pairedNt=A.DG12
   14 G    13    15    11    14 # name=B.DG14, pairedNt=A.DC11
   15 C    14    16    10    15 # name=B.DC15, pairedNt=A.DG10
   16 G    15    17     9    16 # name=B.DG16, pairedNt=A.DC9
   17 A    16    18     8    17 # name=B.DA17, pairedNt=A.DT8
   18 A    17    19     7    18 # name=B.DA18, pairedNt=A.DT7
   19 T    18    20     6    19 # name=B.DT19, pairedNt=A.DA6
   20 T    19    21     5    20 # name=B.DT20, pairedNt=A.DA5
   21 C    20    22     4    21 # name=B.DC21, pairedNt=A.DG4
   22 G    21    23     3    22 # name=B.DG22, pairedNt=A.DC3
   23 C    22    24     2    23 # name=B.DC23, pairedNt=A.DG2
   24 G    23     0     1    24 # name=B.DG24, pairedNt=A.DC1
Note the 0 at the 4th column for A.DG12 which is at the 3′ end of chain A, and the 0 at 3rd column for B.DC13 which is at the 5′ end of chain B.

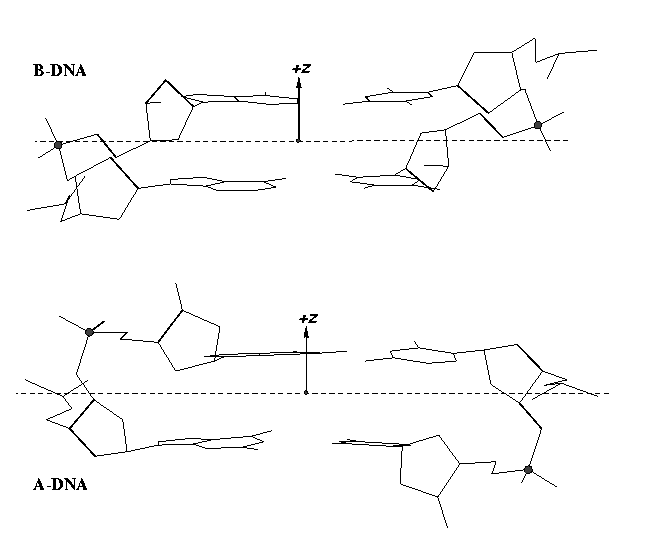
From early on, 3DNA calculates the Zp parameter to separate A- and B-DNA double helical steps. First introduced in the paper A-form conformational motifs in ligand-bound DNA structures (see figure below), Zp is the mean projection of the two phosphorus atoms onto the z-axis of the dimer ‘middle frame’. Zp is greater than 1.5 Å for A-DNA, and it is less than 0.5 Å for B-DNA. As noted in the 3DNA NAR paper, other parameters such as slide should also be examined to confirm conformational assignments based on Zp.
As of v2.1, 3DNA has introduced the single-stranded variant for the Zp parameter (ssZp) as a more robust substitute for the Richardson phosphorus-glycosidic bond distance parameter (Dp) to characterize sugar puckers. See post Sugar pucker correlates with phosphorus-base distance for more details. In 3DNA/DSSR, ssZp is defined as the z-coordinate of the 3′ phosphorus atom expressed in the standard reference frame of the preceding base; it is positive when phosphorus lies on the +z-axis side (base in anti conformation) and negative if phosphorus is on the –z-axis side (base in syn conformation). Note that by definition, Dp should always be positive.
As in the previous post, here I am using G175 and U176 of PDB entry 1jj2 (the large ribosomal subunit of Haloarcula marismortui) as examples to illustrate how the ssZp parameters are calculated. The GpU forms a dinucleotide platform, where the sugar of G175 adopts a C2′-endo conformation, and that of U176 C3′-endo. For verification, here is the PDB data file for fragment 1jj2-G175-U176-A177.pdb (note A177 is included for its phosphorus atom). Run the following 3DNA commands:
find_pair -s 1jj2-G175-U176-A177.pdb stdout
frame_mol -1 ref_frames.dat 1jj2-G175-U176-A177.pdb ref-G175.pdb
frame_mol -2 ref_frames.dat 1jj2-G175-U176-A177.pdb ref-U176.pdb
File ref-G175.pdb contains the following line:
ATOM 24 P U 0 176 -5.624 6.937 1.918 1.00 24.19 P
The z-coordinate of U176 (which is 3′ to G175) is 1.918, which is the ssZp for G175. It is less than 2.9 Å, corresponding to the C2′-endo sugar conformation of G175.
Similarly, file ref-U176.pdb contains the following line:
ATOM 44 P A 0 177 -3.841 6.592 4.377 1.00 25.91 P
So the ssZp for U176 is 4.377, which is greater than 2.9 Å, corresponding to the C3′-endo sugar conformation of U176.
To sum up, the double-stranded Zp as originally available from 3DNA can be used for discriminating A- and B-DNA double-helical steps: Zp > 1.5 Å for A-DNA, and Zp < 0.5 Å for B-DNA. The newly introduced single-stranded Zp is intended for characterizing sugar puckers: Zp > 2.9 Å for C3′-endo, and Zp < 2.9 Å for C2′-endo. Since A-DNA has predominately C3′-endo sugar conformation and B-DNA has C2′-endo sugar, the ssZp parameter would be helpful in classifying a dinucleotide into A- or B-like conformation. A survey of ssZp in well-defined A- and B-DNA structures (as performed for double-stranded Zp) should prove useful.
Realizing the naming confusions of double-stranded Zp vs single-stranded Zp, I am considering to rename single-stranded Zp as ssZp in future releases of 3DNA and DSSR. Do you have any comments or suggestions? Please let me know by leaving a comment!

In addition to the five canonical bases (A, C, G, T, and U), nucleic acid structures in the PDB contains numerous modified variants (natural or engineered) in the nucleobase, sugar, or the phosphate. For instance, the 76-nt (nucleotide) long yeast phenylalanine tRNA (1ehz) contains 14 modified bases: 2MG10, H2U16, H2U17, M2G26, OMC32, OMG34, YYG37, PSU39, 5MC40, 7MG46, 5MC49, 5MU54, PSU55, and 1MA58. Among which, the most prevalent and best-known example is pseudouridine. Note that in the PDB, each residue (including modified nt) is named with an up to three-letter identifier, e.g., PSU for pseudouridine. For a comprehensive list (with chemical and structural information) of small molecules, including modified nts, please refer to the Ligand Expo website hosted by the RCSB PDB.
Given the widespread occurrences of modified bases in nucleic acid structures, any practical structural bioinformatics software should be able to treat them effectively, as with the canonical bases. In 3DNA, from the very beginning, modified bases are mapped to standard counterparts, e.g. 5‐iodouracil (5IU) to uracil (U) and 1‐methyladenine (1MA) to adenine (A), allowing for easy analysis of unusual DNA and RNA structures (see the NAR03 reference). Specifically, in the 3DNA distribution the file baselist.dat contains the mappings explicitly.
As of v2.1, 3DNA automatically maps a new modified base not available in the file baselist.dat. Yet, I have continuously updated the list in line with new DNA/RNA entries released by the PDB. The process is automated with a Ruby script which calls find_pair -s on each nucleic-acid-containing structure to output unknown bases. As an extreme, the baselist.dat file below comprises only canonical bases:
  A   A
  C   C
  G   G
  T   T
  U   U
 DA   A
 DC   C
 DG   G
 DT   T
With the above minimum mapping list, running the command find_pair -s on 1ehz.pdb identifies all the 14 modified bases. A sample case for 2MG is shown below:
Match '2MG' to 'g' for residue 2MG   10  on chain A [#10]
    check it & consider to add line '2MG     g' to file <baselist.dat>
By parsing the output of a batch run on all DNA/RNA-containing entries in the PDB as of October 18, 2013, I identified a total of 596 modified bases. The top portion is as below:
02I     a
08Q     c
08T     a
0AD     g
 0C     c
0DC     c
0DG     g
0DT     t
 0G     g
0KL     u
0KX     c
0KZ     t
An explicit list of base mapping makes the correspondence transparent, and helps avoid ambiguous cases as to which canonical base a modified nt matches to. DSSR uses the same list internally. Hopefully, the information would also be useful to other related projects.

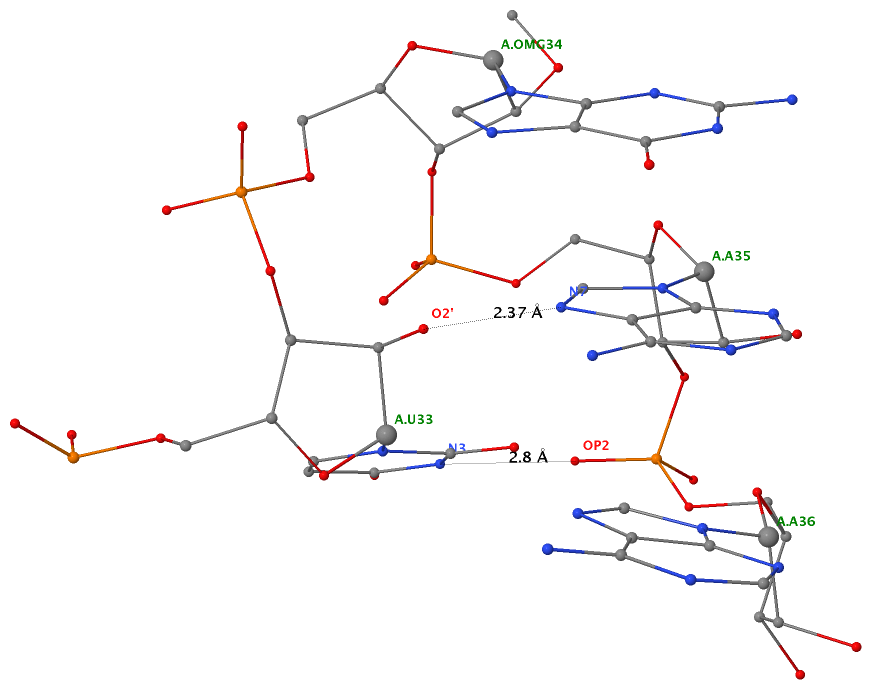
As of beta-r20-on-20130830, DSSR is able to detect two types of U-turns (see the figure below), the UNR-type (left) originally identified by Quigley and Rich [1976] in yeast phenylalanine tRNA, and the GNRA-type (right) later on established by Jucker and Pardi [1995] in GNRA tetra loops. See the Gutell et al. paper Predicting U-turns in Ribosomal RNA with Comparative Sequence Analysis for a more extensive account of U-turns.
As its name implies, a U-turn is characterized by a reversal of the RNA backbone direction within a few nucleotides. Among other factors, the U-turn is stabilized by two key H-bonding interactions, illustrated in dotted lines in the figure below.
Applying DSSR to 1jj2 (the crystal structure of the Haloarcula marismortui large ribosomal subunit) led to the identification of over 30 cases. In addition to the well-documented UNR- and GNRA-type U-turns, the program also finds other variants. An example is shown below, where the U-turn is within a GCA triloop instead of a GNRA tetraloop. Here, the N1 (not N2) atom of G1809 forms an H-bond with OP2 of G1812. The G1809 N2 atom is H-bonded to G1812 O5′ to further stabilize the U-turn.
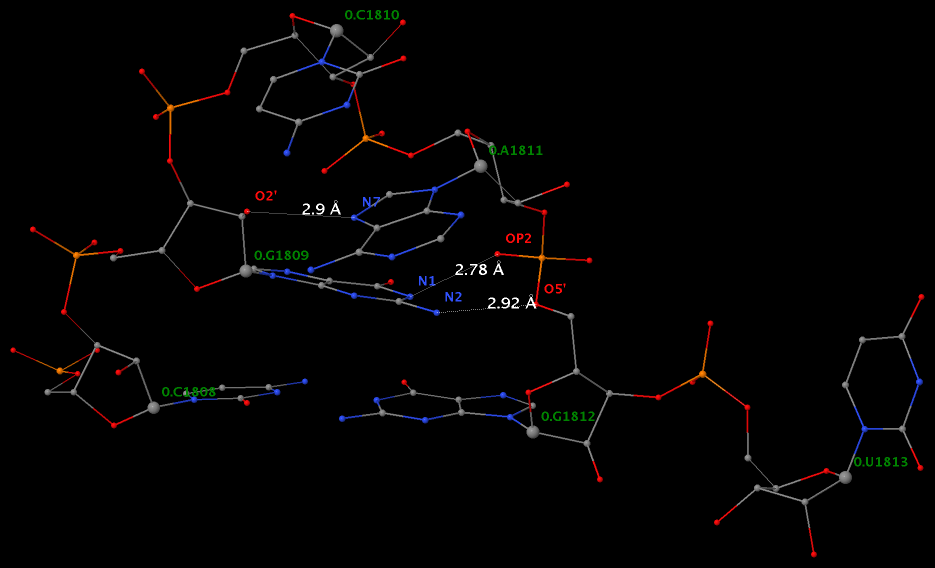
An examination of the chemical structure of the nitrogenous bases (see figure below) shows clearly other possibilities to connect RNA base donors to the phosphate oxygen acceptors. DSSR allows for the exploration of such variations, and more.


3DNA can build DNA/RNA structures with a precise base but approximate sugar-phosphate backbone geometry. In the 2003 3DNA-NAR paper, Table 3 of the section “Structures built with sugar–phosphate backbone” lists “root mean square deviation (in Å) between rebuilt 3DNA models and experimental DNA structures” for three representative DNA structures (in A-form, B-form, and a protein-DNA complex). It was noted that The RMSD of reconstructed versus observed base positions is virtually zero and that for both base and backbone coordinates is <0.85 Å, even for the 146 bp nucleosomal DNA structure.
The backbone geometry is approximate because 3DNA uses a fixed sugar-phosphate conformation (in A-DNA, B-DNA or RNA) that is attached to the corresponding bases in the model building process. The most noticeable effect is the long O3′(i)···P(i+1) bond that connects consecutive nucleotides along a chain. The imprecise structure was intended as a starting point for other objectives (e.g., all-atom molecular dynamics simulations) that are out of the design scope of 3DNA. Nevertheless, over the years, I have been concerned with the overlong O3′—P distance issue. I tried but failed to find a satisfying third-party (command-line driven) tool that can perform restraint optimization of the sugar-phosphate backbone geometry while keeping base atoms fixed.
The problem was finally solved after I attended the 43rd Mid-Atlantic Macromolecular Crystallography Meeting held at Duke University a few months ago. At the meeting, I had the opportunities to talk to several members of the PHENIX team. Particularly, Jeff Headd revised the geometry_minimization component of PHENIX to do the trick. Here is the mail reply from Jeff, using a 3DNA-generated DNA duplex (355d-3dna.pdb) as an example (see full details below):
Here’s a first go at refining just the backbone atoms of you input DNA model. You’ll need the most recently nightly build of Phenix (dev-1395 would work) and then run:
phenix.geometry_minimization 355d-3dna.pdb min.params
using the attached min.params file.
What I specify in the params file is to only move the backbone atoms, which I’ve done with a selection. You can modify the atoms that are allowed to move to your liking.
The only other change was to allow longer distance linkages, as some of the backbone linkages start quite far apart.
The content of file min.params is:
pdb_interpretation {
  link_distance_cutoff = 7.0
}
selection = name " P  " or name " OP1" or name " OP2" or \
            name " O5'" or name " C5'" or name " C4'" or \
            name " O4'" or name " C3'" or name " O3'" or \
            name " C2'"
To make the story complete, given below is the step-by-step procedure, using 355d, a B-DNA dodecamer at 1.4 Å resolution as an example. The corresponding PDB file is named 355d.pdb.
find_pair 355d.pdb stdout | analyze stdin
x3dna_utils cp_std bdna
rebuild -atomic bp_step.par 355d-3dna.pdb
# the rebuilt structure is called '355d-3dna.pdb'

# with Phenix dev-1395 and above
phenix.geometry_minimization 355d-3dna.pdb min.params
# the optimized structure is called '355d-3dna_minimized.pdb'

# to verify:
find_pair 355d-3dna.pdb stdout | analyze stdin
find_pair 355d-3dna_minimized.pdb stdout | analyze stdin
# check files '355d-3dna.out' and '355d-3dna_minimized.out'
The three key files mentioned above are provided here for your verification:
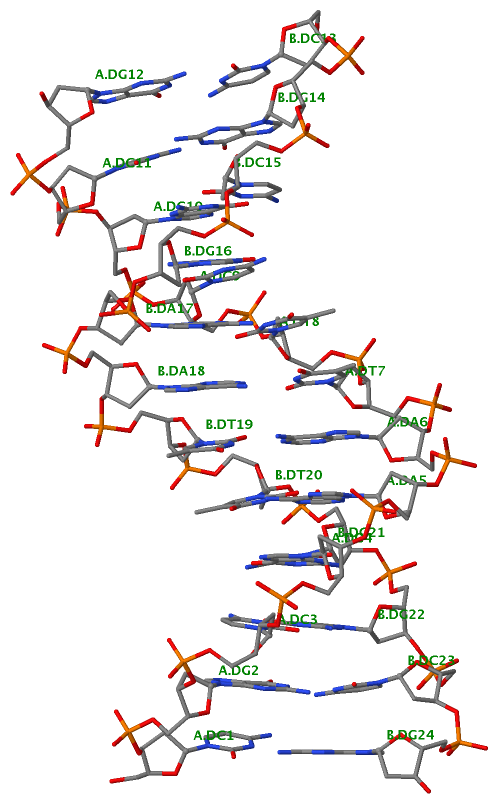
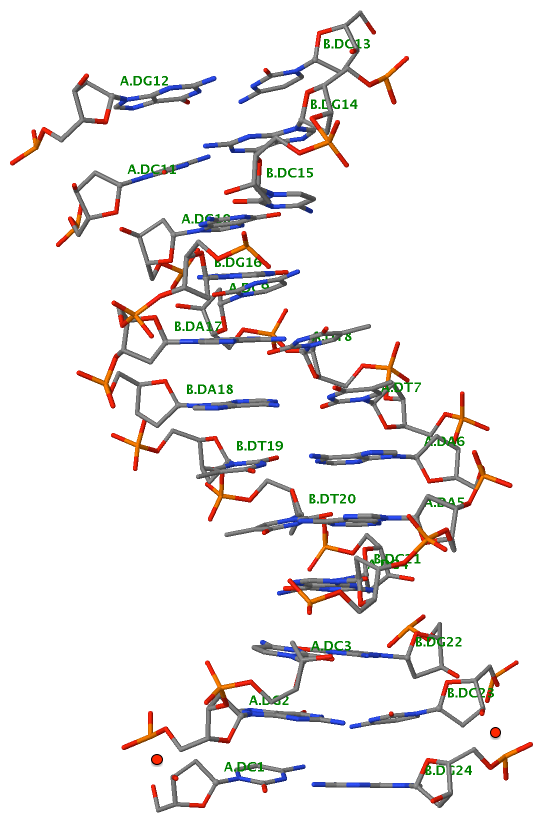
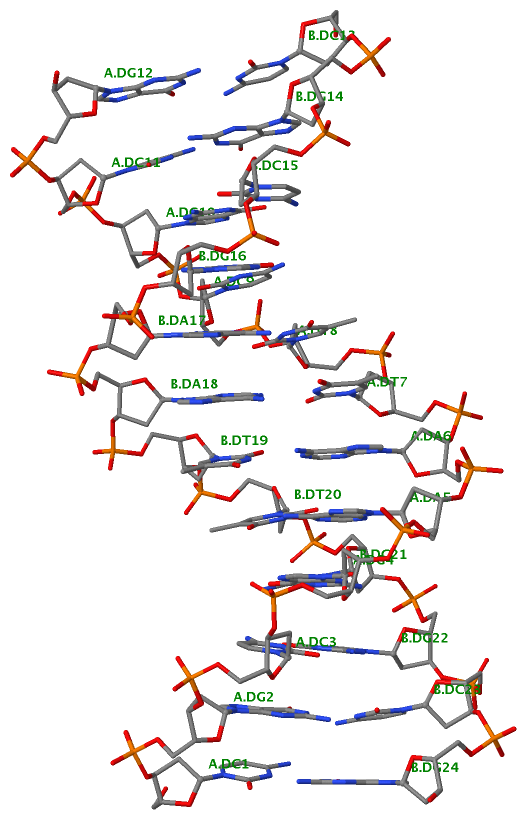
Finally, the following figure illustrates the B-DNA dodecamer duplex in experimental (left), 3DNA-generated (middle) and PHENIX-optimized (right) coordinates. Note that disconnected O3′—P linkages (marked by red dots for two cases, see bottom of the middle image) due to overlong distances in 3DNA-rebuilt structure are fixed following the restraint PHENIX optimization.
| 355d-experimental |
3DNA-rebuilt |
PHENIX-optimized |
 |
 |
 |
Note added on 2016-11-11: In the min.params file, the selection is in one long line. For illustration purpose, the selection section (see below) is split into serveral short lines in the blog post. However, PHENIX requires ending backslashes (\) to combine the split lines into a single grammatical unit. I was not aware of this strict rule, and missed to add the ending \s in the original post. Thanks to Oleg Sobolev from the PHENIX team for pointing out this omission to my attention. Note that the content of min.params did not have a problem, and thus no change is made.
pdb_interpretation {
  link_distance_cutoff = 7.0
}
selection = name " P  " or name " OP1" or name " OP2" or \
            name " O5'" or name " C5'" or name " C4'" or \
            name " O4'" or name " C3'" or name " O3'" or \
            name " C2'"

One of DSSR’s noteworthy features is the auto-detection of helical junctions in nucleic acids structures, be it RNA, DNA, or chimeric DNA/RNA, consisting of one or multiple chains. Helical junctions are created at the interface of three and more stems composed of canonical pairs (Watson-Crick A—T/U and G—C, or wobble G—U). A three-way junction model is illustrated below (copied from Figure 1 of the Bindewald et al. RNAJunction paper). Note that the three chains are each continuous (i.e., consecutive nts are covalently connected), and together with the three inner bps, forming a loop in the middle. Here, the three-way junction is of type [3×2×3], and the loop is composed of a total of 3×2+3+2+3 = 14 nts.

DSSR automatically detects all existing helical junctions in a nucleic acid structure, as illustrated by the following examples.
1l6b [all DNA Holliday junction structure of d(CCGGTACm5CGG)]
This is a simple four-way junction of type [0×0×0×0], where all bases are paired, leaving no connecting nts. The related portion of DSSR output is:
List of 1 junction(s)
   1 4-way junctions: 8 nts; [0x0x0x0]; linked by [#1, #2, #4, #3]
       1:A.DA6+1:A.DC7+2:B.DG14+2:B.DT15+2:A.DA6+2:A.DC7+1:B.DG14+1:B.DT15 [ACGTACGT]
       0 nts junction ; 1:A.DA6-->1:A.DC7 [AC]
       0 nts junction ; 2:B.DG14-->2:B.DT15 [GT]
       0 nts junction ; 2:A.DA6-->2:A.DC7 [AC]
       0 nts junction ; 1:B.DG14-->1:B.DT15 [GT]
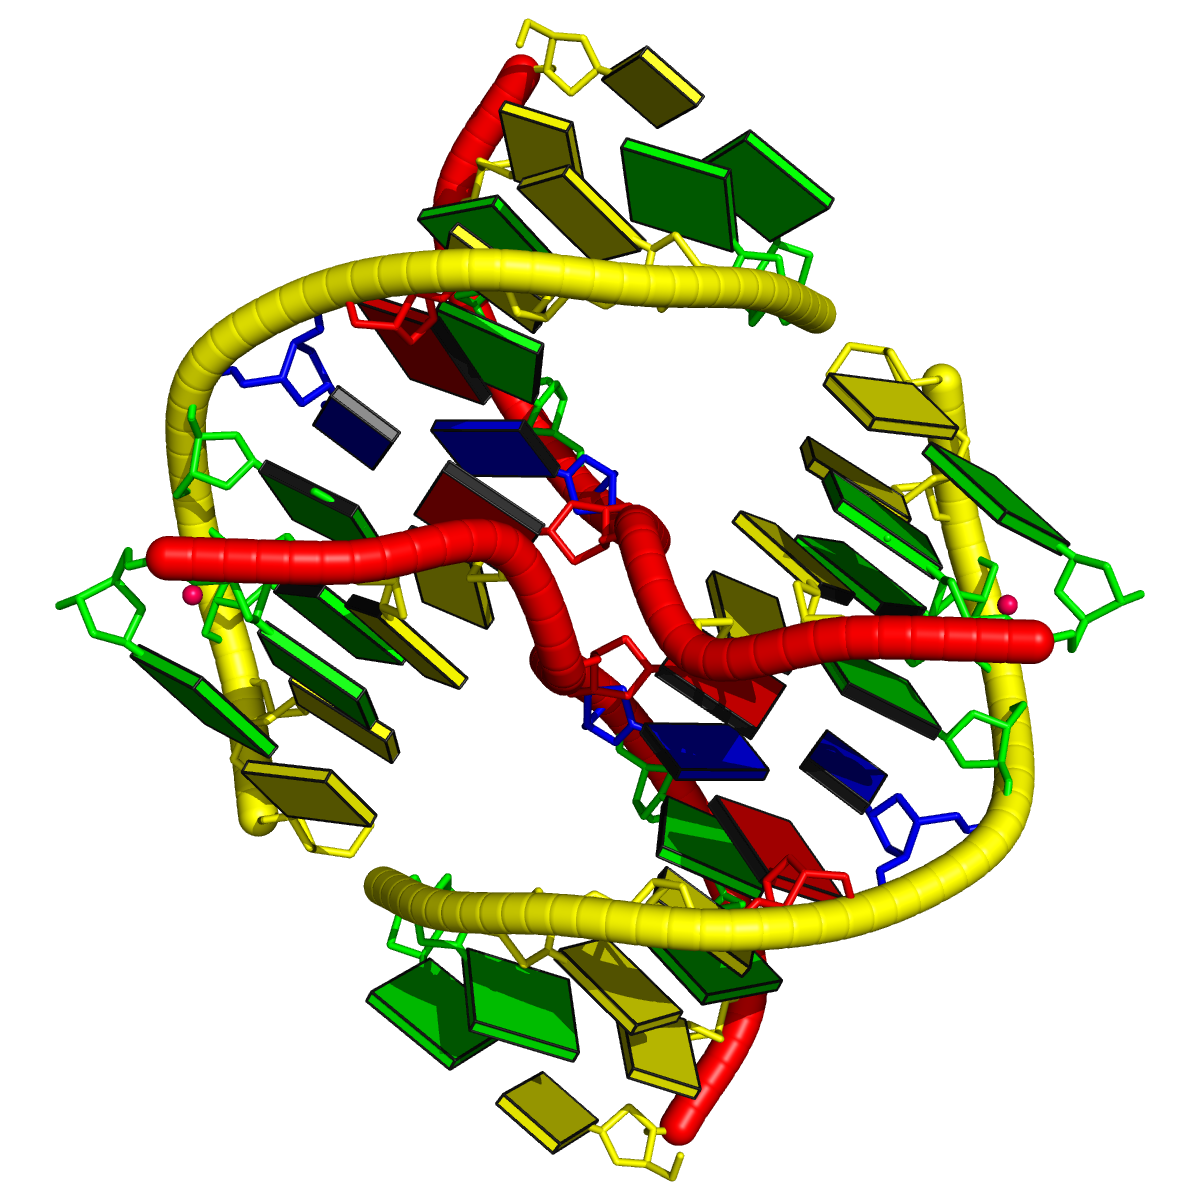
Technically, note the following points:
- The four-way junction is derived from the biological assembly 1 (PDB file
1l6b.pdb1), which contains two copies of the asymmetric unit, delineated by MODEL/ENDMDL. By default, DSSR/3DNA works one structure at a time, corresponding to the first structure/model in a given PDB or mmCIF file. To take the biological assembly as a whole, and to avoid confusions with MODEL/ENDMDL delineated NMR entries, the ENDMDL record of the first model is commented out in the file (1l6b.pdb1), as below:
#ENDMDL
MODEL        2
- With the modified PDB file
1l6b.pdb1, the DSSR command can be run as x3dna-dssr -i=1l6b.pdb1, with the output going to stdout.
- The simplified schematic block png image was generated with the command below to create the Raster3D
.r3d file (1l6b.r3d), which was then ray-traced using PyMOL.
blocview -r 1l6b.r3d 1l6b.pdb1
1egk [a four-way DNA/RNA junction]
This four-way junction consists of both DNA and RNA chains. Here the helical junction may not be that obvious by directly looking at the 3D image.
List of 1 junction(s)
   1 4-way junctions: 10 nts; [0x0x1x1]; linked by [#3, #-1, #4, #5]
       B.DC37+B.DT38+B.DA45+B.DC46+C.G109+C.A110+C.U111+D.DA130+D.DG131+D.DG132 [CTACGAUAGG]
       0 nts junction ; B.DC37-->B.DT38 [CT]
       0 nts junction ; B.DA45-->B.DC46 [AC]
       1 nts junction C.A110 [A]; C.G109-->C.U111 [GAU]
       1 nts junction D.DG131 [G]; D.DA130-->D.DG132 [AGG]
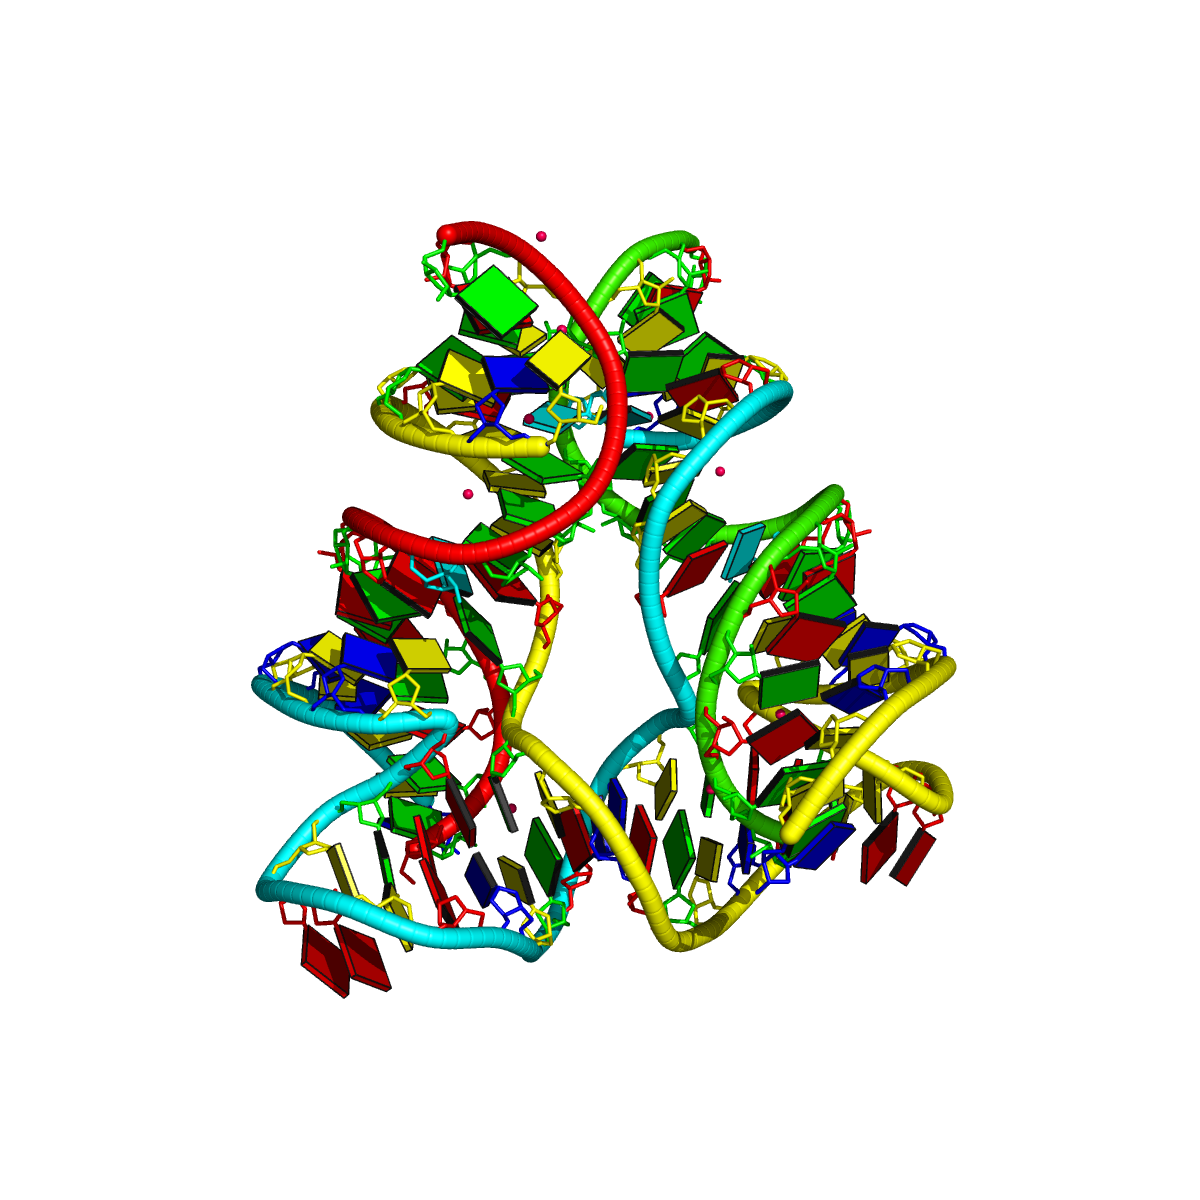
1ehz [yeast phenylalanine tRNA]
As shown below, DSSR correctly detects the classic L-shaped 3D structure and the cloverleaf 2D structure of a tRNA.
List of 1 junction(s)
   1 4-way junctions: 16 nts; [2x1x5x0]; linked by [#1, #2, #3, #4]
       A.U7+A.U8+A.A9+A.2MG10+A.C25+A.M2G26+A.C27+A.G43+A.A44+A.G45+A.7MG46+A.U47+A.C48+A.5MC49+A.G65+A.A66 [UUAgCgCGAGgUCcGA]
       2 nts junction A.U8+A.A9 [UA]; A.U7-->A.2MG10 [UUAg]
       1 nts junction A.M2G26 [g]; A.C25-->A.C27 [CgC]
       5 nts junction A.A44+A.G45+A.7MG46+A.U47+A.C48 [AGgUC]; A.G43-->A.5MC49 [GAGgUCc]
       0 nts junction ; A.G65-->A.A66 [GA]
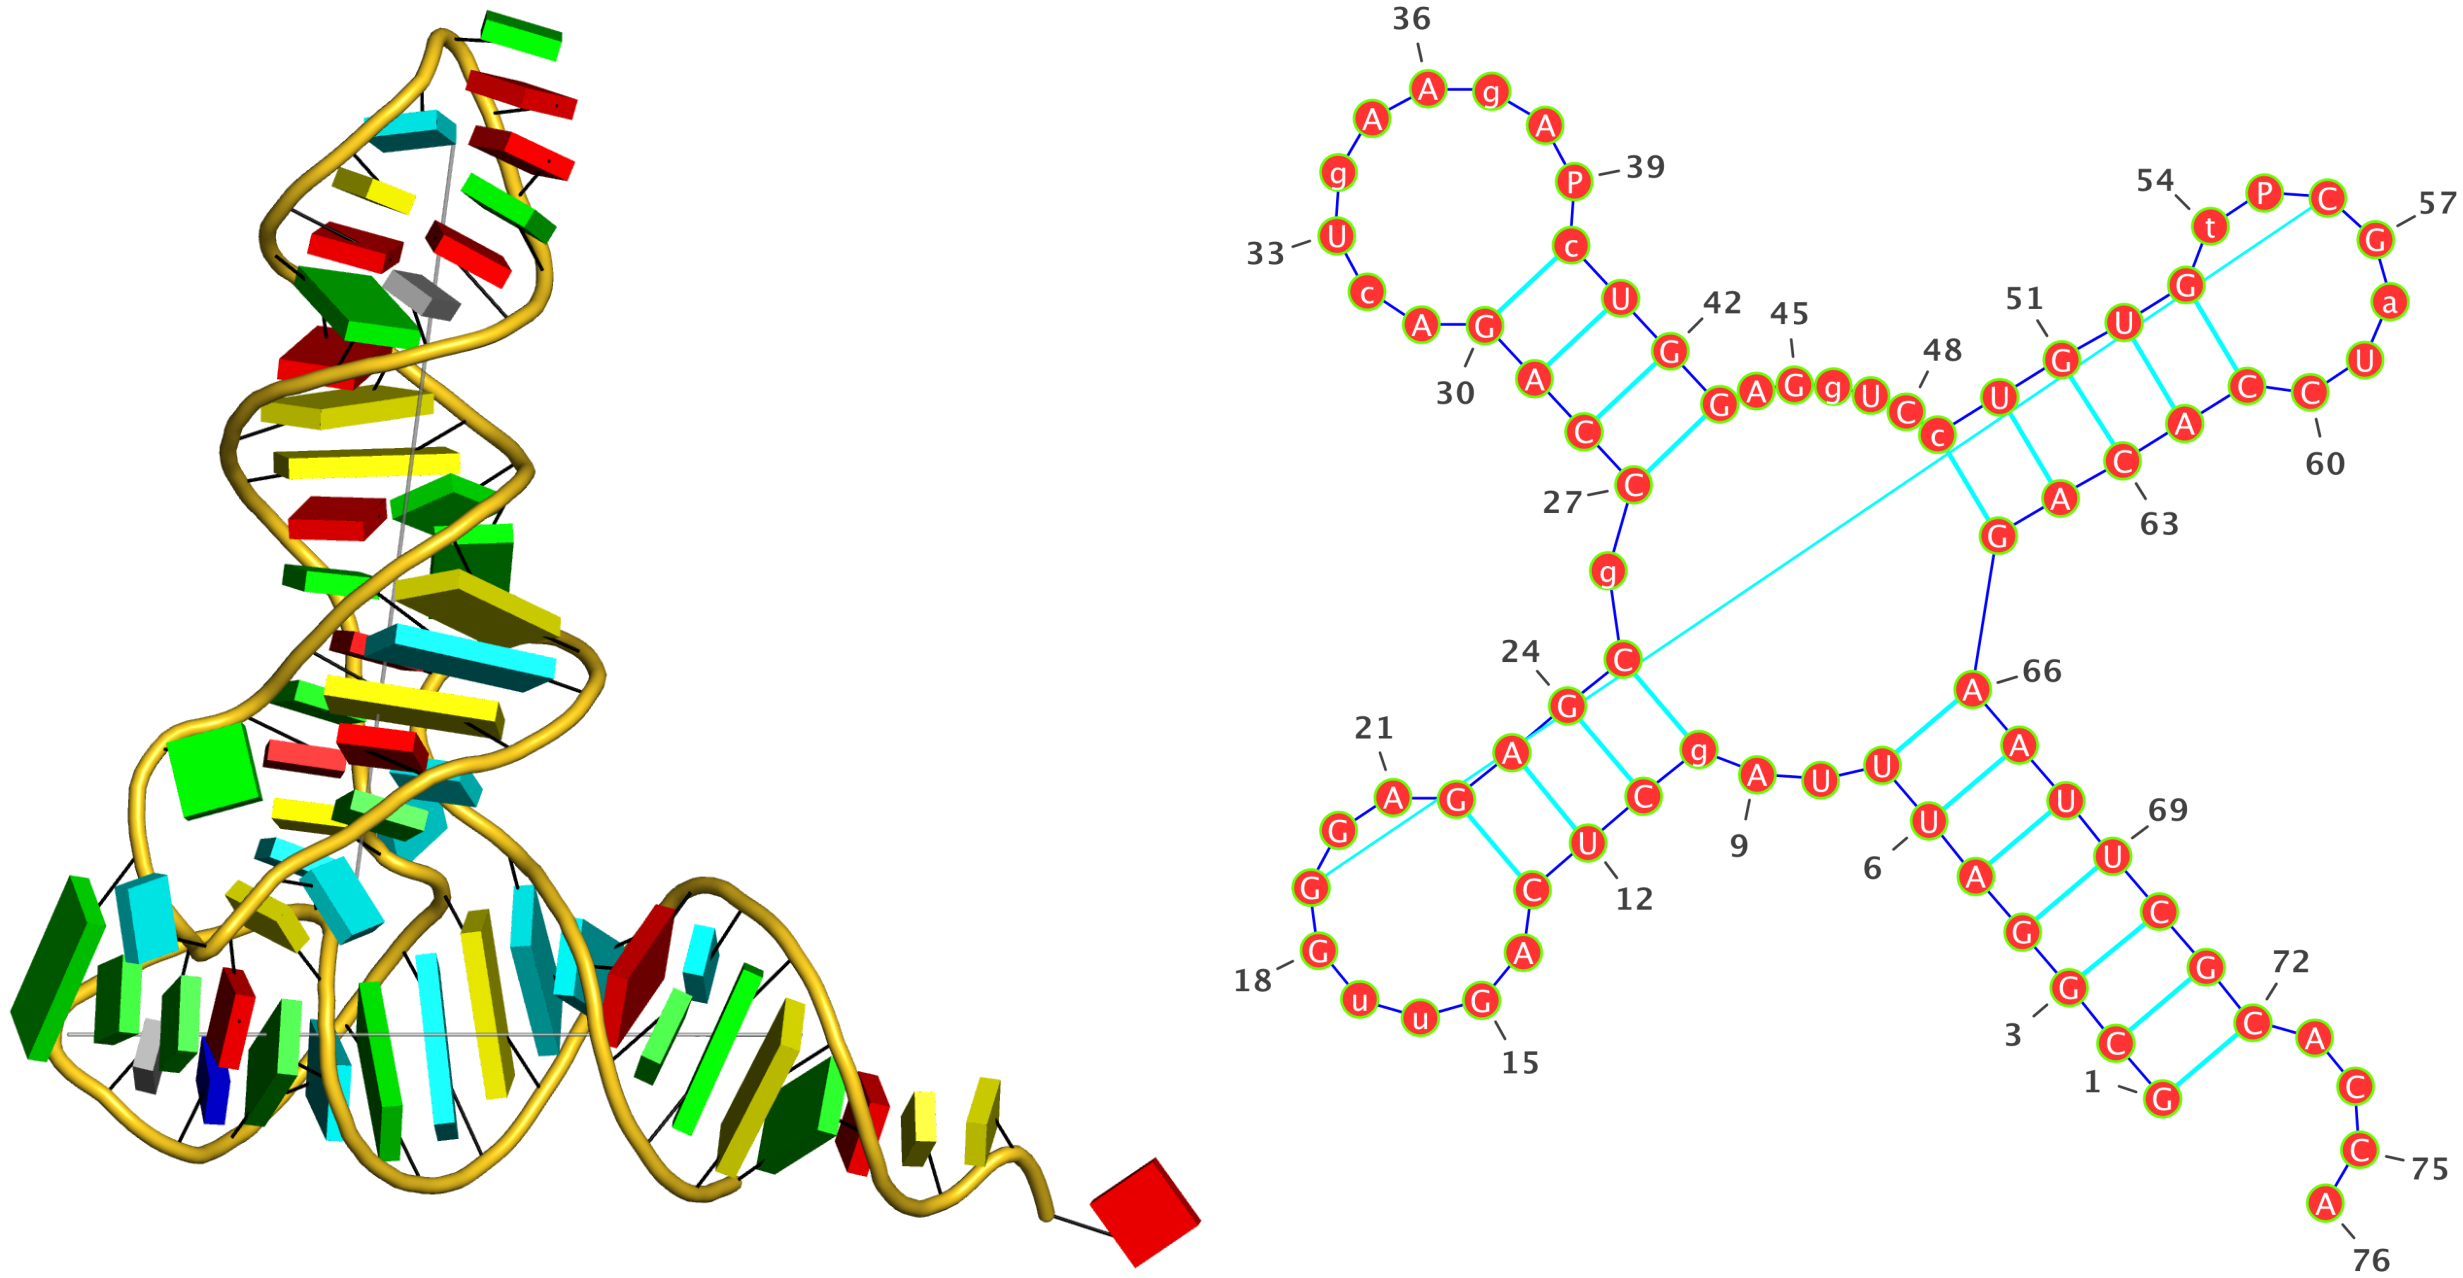
2fk6 [RNAse Z/tRNA(Thr) complex]
In a recent paper Predicting Helical Topologies in RNA Junctions as Tree Graphs by Laing et al., this PDB entry was selected in Table 1 as containing a three-way junction. However, DSSR fails to detect any junction in this structure, even though the program does find co-axial stacks. It turns out that the PDB entry 2fk6 does not possess the anti-codon stem/loop, thus nts C25 and G46 are not covalently connected. While three-way junctions may be defined differently, the DSSR result follows the above mentioned chain-continuity requirement.
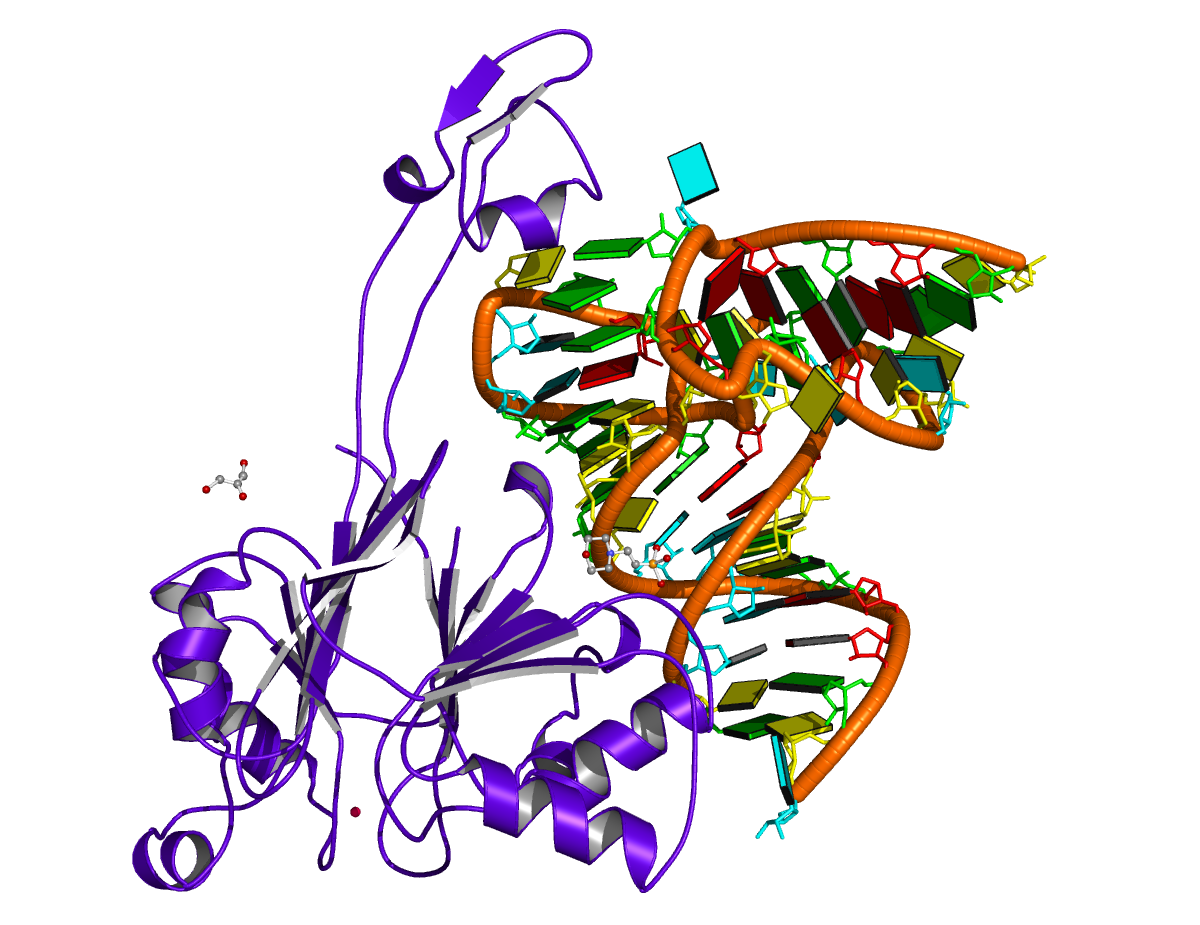
Overall, DSSR can consistently find all helical junctions in a given nucleic acid structure. Try DSSR on a ribosomal structure, you may well appreciate what it reveals. Moreover, it is straightforward to apply the program to all RNA/DNA-containing entries in the PDB via a script.


![1msy [GUAA tetra loop] in 3d and 2d representations 1msy [GUAA tetra loop] in 3d and 2d representations](http://forum.x3dna.org/images/1msy-3d-2d.png)

