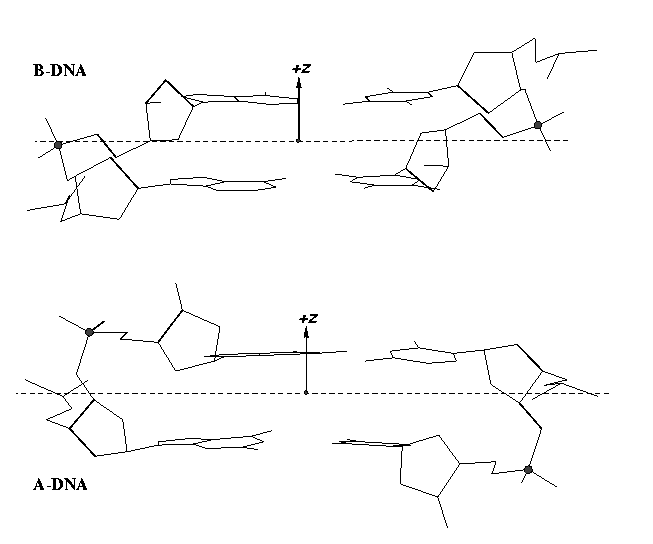
From v1.5 or even earlier on, 3DNA provides an automatic classification of a dinucleotide step into A-, B- or TA-DNA conformation. Figure 5 of the 2003 3DNA Nucleic Acids Research paper (NAR03) shows three sets of scatter plots — helical inclination and x‐displacement, dimer step Roll and Slide, and the projected phosphorus z coordinates Zp and Zp(h) — to differentiate the A-, B- and TA-DNA dinucleotide steps.
Among the criteria tested, the most discriminative ones are the projected phosphorus z coordinates, Zp in the middle step frame (see figure below), and Zp(h) defined similarly but in the middle helical frame.
Over the years, I have received many questions regarding the datasets used in generating Figure 5 of NAR03. Back in August 2006, a user asked for IDs of the TA-DNA structures — see DNA standards/statistics using 3DNA. In April 2007, another user requested the same TA-DNA dataset. Early this year, a user asked for 3DNA’s A-DNA definition. More recently, yet another user would like to ask about the DNA set used for the analysis that is presented in Fig 5. in the NAR 2003 paper.
I am glad to see that after nearly a decade of the NAR03 publication, the user community is still interested in knowing details in the work. So I decided to dig into my archive for the original data files and scripts used to generate Figure 5 of NAR03. It was not an easy journey; just releasing the data files and scripts is not enough, I’d like to verify that they work together as intended in today’s computing environment. Luckily, I am finally able to get to the bottom of the issues. The details are in the post Datasets and scripts for reproducing Figure 5 of the 3DNA NAR03 paper. The tarball file named 3DNA-NAR03-Fig5.tar.gz is available by clicking the link.


