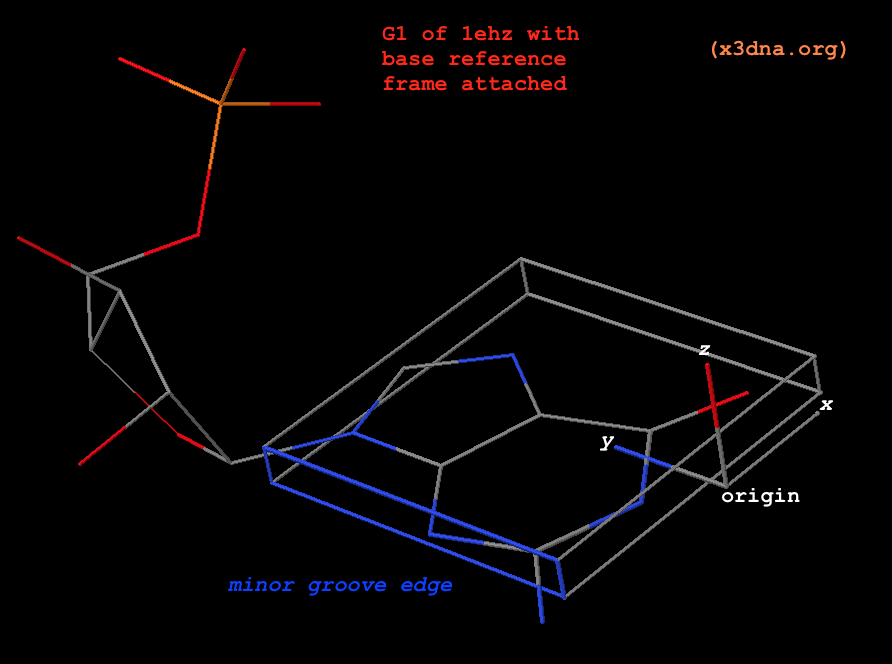
Once a nucleotide (nt) is identified, and matched to A (C, G, T, U) for the standard case or a (c, g, t, u) for a modified one, 3DNA/DSSR performs a least-squares fitting procedure to locate the base reference frame in three-dimensional space. The basic idea is very simple and widely applicable. The algorithm constitutes one of the key components of 3DNA/DSSR. As always, the details can be most effectively illustrated with a worked example. Using G1 in the yeast phenylalanine tRNA (PDB id: 1ehz) as an example, the atomic coordinates of its nine base-ring atoms are:
# G1, nine base-ring atoms for ls-fitting
ATOM     14  N9    G A   1      51.628  45.992  53.798  1.00 93.67           N
ATOM     15  C8    G A   1      51.064  46.007  52.547  1.00 92.60           C
ATOM     16  N7    G A   1      51.379  44.966  51.831  1.00 91.19           N
ATOM     17  C5    G A   1      52.197  44.218  52.658  1.00 91.47           C
ATOM     18  C6    G A   1      52.848  42.992  52.425  1.00 90.68           C
ATOM     20  N1    G A   1      53.588  42.588  53.534  1.00 90.71           N
ATOM     21  C2    G A   1      53.685  43.282  54.716  1.00 91.21           C
ATOM     23  N3    G A   1      53.077  44.429  54.946  1.00 91.92           N
ATOM     24  C4    G A   1      52.356  44.836  53.879  1.00 92.62           C
The corresponding nine base-ring atoms of G in its standard base reference frame are listed below. See Table 1 of the report A Standard Reference Frame for the Description of Nucleic Acid Base-pair Geometry, and file Atomic_G.pdb distributed with 3DNA ($X3DNA/config/Atomic_G.pdb). In DSSR, the content has been integrated into the source code to make the program self-contained.
# G in standard base reference frame
ATOM      2  N9    G A   1      -1.289   4.551   0.000
ATOM      3  C8    G A   1       0.023   4.962   0.000
ATOM      4  N7    G A   1       0.870   3.969   0.000
ATOM      5  C5    G A   1       0.071   2.833   0.000
ATOM      6  C6    G A   1       0.424   1.460   0.000
ATOM      8  N1    G A   1      -0.700   0.641   0.000
ATOM      9  C2    G A   1      -1.999   1.087   0.000
ATOM     11  N3    G A   1      -2.342   2.364   0.001
ATOM     12  C4    G A   1      -1.265   3.177   0.000
A least-squares fitting of the standard onto the experimental set of base-ring atoms defines the base reference frame (Fig. 1). The information is available via the following commands:
# find_pair -s 1ehz.pdb # in file 'ref_frames.dat'
...     1 G   # A:...1_:[..G]G
   53.7571    41.8678    52.9303  # origin
   -0.2589    -0.2496    -0.9331  # x-axis
   -0.5430     0.8365    -0.0731  # y-axis
    0.7988     0.4878    -0.3521  # z-axis
# --------
# x3dna-dssr -i=1ehz.pdb --json | jq .nts[0].frame
{
  rsmd: 0.008,
  origin: [53.757, 41.868, 52.93],
  x_axis: [-0.259, -0.25, -0.933],
  y_axis: [-0.543, 0.837, -0.073],
  z_axis: [0.799, 0.488, -0.352]
}

Fig. 1: G1 in tRNA 1ehz, with base reference frame attached
Please note the following subtle points:
- The standard base (
Atomic_G.pdb) is already set in its reference frame: the _z_-coordinates are virtually zeros, _y_-coordinates are positive, the atoms along the minor-groove edge have negative _x_-coordinates, as can be visualized clearly from the attached coordinate frame. In 3DNA, the five standard standard bases are in stored in filesAtomic_[ACGTU].pdb, and the corresponding modified ones are inAtomic_[acgtu].pdb. For simplicity,Atomic_A.pdbandAtomic_a.pdbare the same by default, as are the other four cases.
- The translation and rotation of the least-squares fitting process define the experimental base reference frame (for G1 in the above example), and its three axes are orthonormal by definition.
- By design, the base rings of
Atomic_A.pdbandAtomic_G.pdb match each other closely (see below), as are the pyrimidines bases. The least-square fitted root-mean-square deviation (rmsd) of the nine base-ring atoms between standard A and G is only 0.04 Å. Fitting the standard A (instead of G) onto G1 of 1ehz leads to a base reference frame that is essentially indistinguishable from the one above (see below). This feature shows that any ambiguity in assigning modified purines to A or G, or pyrimidines to C, T, or U causes no notable differences in 3DNA/DSSR results.
Comparison of base-ring atomic coordinates in standard G and A
          Atomic_G.pdb                         Atomic_A.pdb
N9 G   -1.289   4.551   0.000   |   N9  A   -1.291   4.498   0.000
C8 G    0.023   4.962   0.000   |   C8  A    0.024   4.897   0.000
N7 G    0.870   3.969   0.000   |   N7  A    0.877   3.902   0.000
C5 G    0.071   2.833   0.000   |   C5  A    0.071   2.771   0.000
C6 G    0.424   1.460   0.000   |   C6  A    0.369   1.398   0.000
N1 G   -0.700   0.641   0.000   |   N1  A   -0.668   0.532   0.000
C2 G   -1.999   1.087   0.000   |   C2  A   -1.912   1.023   0.000
N3 G   -2.342   2.364   0.001   |   N3  A   -2.320   2.290   0.000
C4 G   -1.265   3.177   0.000   |   C4  A   -1.267   3.124   0.000
Comparison of G1 (1ehz) base reference frame derived using standard G or A
             Atomic_G.pdb                |             Atomic_A.pdb
 53.7571    41.8678    52.9303  # origin | 53.7286    41.9276    52.9482  # origin
 -0.2589    -0.2496    -0.9331  # x-axis | -0.2562    -0.2540    -0.9327  # x-axis
 -0.5430     0.8365    -0.0731  # y-axis | -0.5444     0.8352    -0.0780  # y-axis
  0.7988     0.4878    -0.3521  # z-axis |  0.7988     0.4878    -0.3522  # z-axis
